Estimated Value: $715,000 - $794,000
4
Beds
2
Baths
1,494
Sq Ft
$499/Sq Ft
Est. Value
About This Home
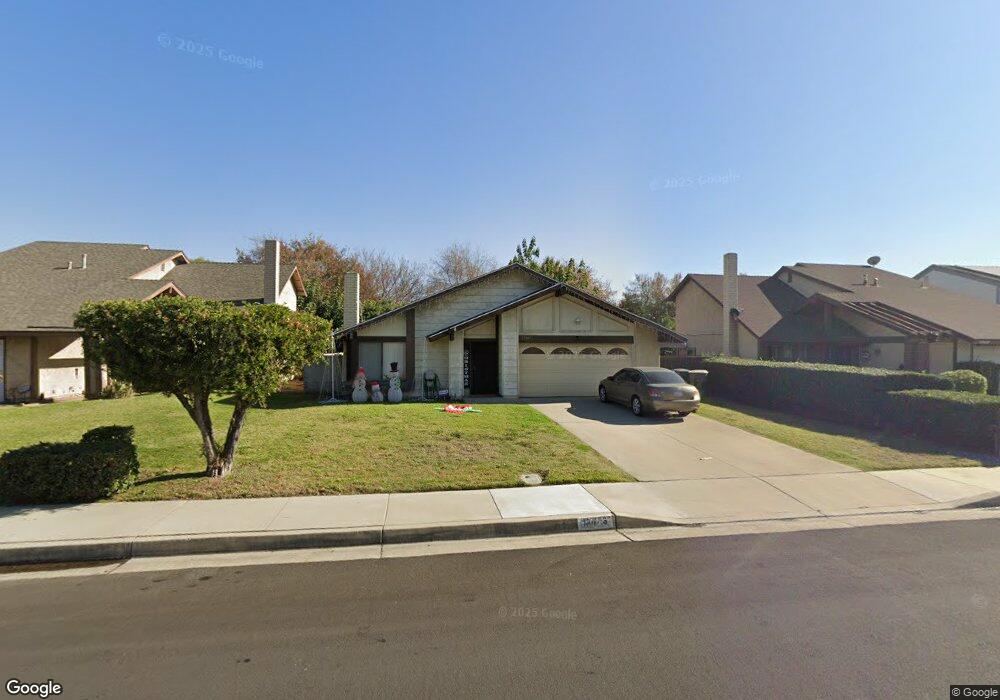
This home is located at 12443 Tamarisk Ln, Chino, CA 91710 and is currently estimated at $745,945, approximately $499 per square foot. 12443 Tamarisk Ln is a home located in San Bernardino County with nearby schools including Alicia Cortez Elementary, Magnolia Junior High, and Chino High School.
Ownership History
Date
Name
Owned For
Owner Type
Purchase Details
Closed on
Jun 3, 2008
Sold by
Guadagno Luigi G
Bought by
Guadagno Luigi G and Guadagno Mary G
Current Estimated Value
Home Financials for this Owner
Home Financials are based on the most recent Mortgage that was taken out on this home.
Original Mortgage
$200,000
Outstanding Balance
$126,593
Interest Rate
5.87%
Mortgage Type
Purchase Money Mortgage
Estimated Equity
$619,352
Purchase Details
Closed on
Apr 25, 2008
Sold by
Kolb Roger Frank
Bought by
Guadagno Luigi G and Guadagno Mary G
Home Financials for this Owner
Home Financials are based on the most recent Mortgage that was taken out on this home.
Original Mortgage
$200,000
Outstanding Balance
$126,593
Interest Rate
5.87%
Mortgage Type
Purchase Money Mortgage
Estimated Equity
$619,352
Purchase Details
Closed on
Jun 23, 2007
Sold by
Kolb Zilpha A
Bought by
Zilpha Aleatha Kolb Revocable Living Tr
Create a Home Valuation Report for This Property
The Home Valuation Report is an in-depth analysis detailing your home's value as well as a comparison with similar homes in the area
Home Values in the Area
Average Home Value in this Area
Purchase History
| Date | Buyer | Sale Price | Title Company |
|---|---|---|---|
| Guadagno Luigi G | -- | Chicago Title Company | |
| Guadagno Luigi G | $325,000 | Chicago Title Company | |
| Zilpha Aleatha Kolb Revocable Living Tr | -- | None Available |
Source: Public Records
Mortgage History
| Date | Status | Borrower | Loan Amount |
|---|---|---|---|
| Open | Guadagno Luigi G | $200,000 |
Source: Public Records
Tax History Compared to Growth
Tax History
| Year | Tax Paid | Tax Assessment Tax Assessment Total Assessment is a certain percentage of the fair market value that is determined by local assessors to be the total taxable value of land and additions on the property. | Land | Improvement |
|---|---|---|---|---|
| 2025 | $4,639 | $426,896 | $149,413 | $277,483 |
| 2024 | $4,639 | $418,525 | $146,483 | $272,042 |
| 2023 | $4,510 | $410,319 | $143,611 | $266,708 |
| 2022 | $4,484 | $402,273 | $140,795 | $261,478 |
| 2021 | $4,397 | $394,385 | $138,034 | $256,351 |
| 2020 | $4,340 | $390,341 | $136,619 | $253,722 |
| 2019 | $4,264 | $382,687 | $133,940 | $248,747 |
| 2018 | $4,170 | $375,184 | $131,314 | $243,870 |
| 2017 | $4,096 | $367,827 | $128,739 | $239,088 |
| 2016 | $3,827 | $360,615 | $126,215 | $234,400 |
| 2015 | $3,751 | $355,198 | $124,319 | $230,879 |
| 2014 | $3,676 | $348,240 | $121,884 | $226,356 |
Source: Public Records
Map
Nearby Homes
- 6763 Poinsettia Ct
- 12476 Park Ave
- 12482 Silkleaf Ave
- 6703 Poinsettia Ct
- 6703 Aster Ct
- 320 W Walnut St Unit 6
- 2350 S Via Esplanade Unit 31
- 6542 Hamilton St
- 2333 S Via Esplanade Unit 25
- 2343 S Via Veranda Unit 10
- 558 W Philadelphia St
- 12689 Cypress Ave
- 6766 Foxcroft Ct
- 209 W Via Rua Flores
- 2890 S Via Belamaria
- 12834 Zinnea Ave
- 6630 Mogano Dr
- 12891 Somerset Place
- 6648 Riverside Dr Unit 3
- 310 E Philadelphia St Unit 35
- 12433 Tamarisk Ln
- 12453 Tamarisk Ln
- 12423 Tamarisk Ln
- 12463 Tamarisk Ln
- 12413 Tamarisk Ln
- 12473 Tamarisk Ln
- 6766 Primrose Ct
- 12466 Park Ave
- 6753 Poinsettia Ct
- 12468 Park Ave
- 6756 Primrose Ct
- 12403 Tamarisk Ln
- 12483 Tamarisk Ln
- 12440 Park Ave
- 12472 Park Ave
- 12444 Park Ave
- 12446 Park Ave
- 6766 Poinsettia Ct
- 12450 Park Ave
- 12434 Park Ave