12444 Foxglove Ct Rancho Cucamonga, CA 91739
Victoria NeighborhoodEstimated Value: $684,206 - $736,000
3
Beds
2
Baths
1,213
Sq Ft
$585/Sq Ft
Est. Value
About This Home
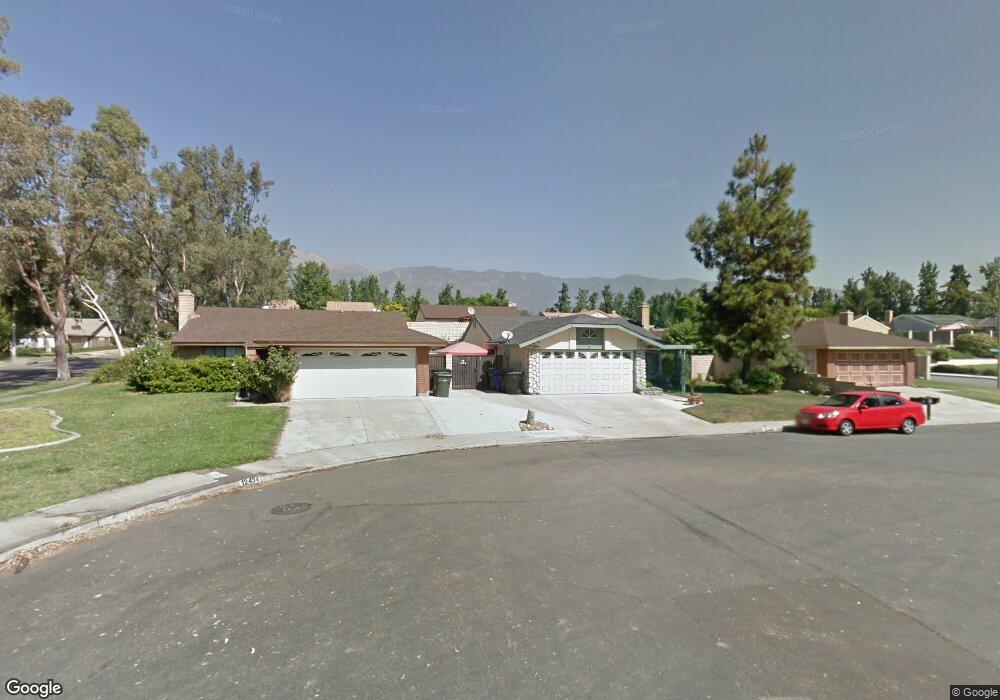
This home is located at 12444 Foxglove Ct, Rancho Cucamonga, CA 91739 and is currently estimated at $709,552, approximately $584 per square foot. 12444 Foxglove Ct is a home located in San Bernardino County with nearby schools including Windrows Elementary School, Etiwanda Intermediate, and Rancho Cucamonga High School.
Ownership History
Date
Name
Owned For
Owner Type
Purchase Details
Closed on
Oct 28, 2024
Sold by
Ishag Joseph
Bought by
Joseph Ishag Living Trust and Ishag
Current Estimated Value
Purchase Details
Closed on
Jun 22, 2001
Sold by
Ishag Tina
Bought by
Ishag Joseph and Ishag Laila
Home Financials for this Owner
Home Financials are based on the most recent Mortgage that was taken out on this home.
Original Mortgage
$106,000
Interest Rate
8.59%
Purchase Details
Closed on
Apr 8, 1998
Sold by
Ocwen Federal Bank Fsb
Bought by
Ishag Tina
Home Financials for this Owner
Home Financials are based on the most recent Mortgage that was taken out on this home.
Original Mortgage
$89,600
Interest Rate
3.95%
Purchase Details
Closed on
May 19, 1997
Sold by
Cox L Bernard
Bought by
Ocwen Federal Bank Fsb
Purchase Details
Closed on
Jan 12, 1997
Sold by
Cox L Bernard
Bought by
Sleeper Nolan
Create a Home Valuation Report for This Property
The Home Valuation Report is an in-depth analysis detailing your home's value as well as a comparison with similar homes in the area
Home Values in the Area
Average Home Value in this Area
Purchase History
| Date | Buyer | Sale Price | Title Company |
|---|---|---|---|
| Joseph Ishag Living Trust | -- | None Listed On Document | |
| Ishag Joseph | -- | First American Title Ins Co | |
| Ishag Tina | $112,000 | Fidelity National Title | |
| Ocwen Federal Bank Fsb | $100,500 | Stewart Title | |
| Sleeper Nolan | -- | -- |
Source: Public Records
Mortgage History
| Date | Status | Borrower | Loan Amount |
|---|---|---|---|
| Previous Owner | Ishag Joseph | $106,000 | |
| Previous Owner | Ishag Tina | $89,600 |
Source: Public Records
Tax History Compared to Growth
Tax History
| Year | Tax Paid | Tax Assessment Tax Assessment Total Assessment is a certain percentage of the fair market value that is determined by local assessors to be the total taxable value of land and additions on the property. | Land | Improvement |
|---|---|---|---|---|
| 2025 | $3,393 | $251,142 | $62,785 | $188,357 |
| 2024 | $3,393 | $246,218 | $61,554 | $184,664 |
| 2023 | $3,293 | $241,390 | $60,347 | $181,043 |
| 2022 | $3,229 | $236,657 | $59,164 | $177,493 |
| 2021 | $3,170 | $232,017 | $58,004 | $174,013 |
| 2020 | $3,136 | $229,638 | $57,409 | $172,229 |
| 2019 | $3,067 | $225,135 | $56,283 | $168,852 |
| 2018 | $3,060 | $220,720 | $55,179 | $165,541 |
| 2017 | $2,934 | $216,392 | $54,097 | $162,295 |
| 2016 | $2,855 | $212,149 | $53,036 | $159,113 |
| 2015 | $2,828 | $208,962 | $52,239 | $156,723 |
| 2014 | $2,765 | $204,869 | $51,216 | $153,653 |
Source: Public Records
Map
Nearby Homes
- 12356 Thistle Dr
- 12325 Bellflower Ct
- 6921 Dahlia Ct
- 12331 Dove Tree Dr
- 6732 Plum Way
- 12420 Silk Oak Ct
- 6502 Dogwood Place
- 6992 Fontaine Place
- 7077 Iris Place
- 7068 Crocus Ct
- 7067 Fontaine Place
- 6822 Foxtail Ct
- 12584 Atwood Ct Unit 1211
- 12164 Wembley Ct
- 7153 Walcott Place
- 6575 Etiwanda Ave
- 6525 Etiwanda Ave
- 12501 Solaris Dr Unit 42
- 13031 Vista St
- 11948 Stegmeir Dr
- 12454 Foxglove Ct
- 12434 Foxglove Ct
- 12441 Tamarisk Dr
- 12451 Tamarisk Dr
- 12431 Tamarisk Dr
- 12351 Daisy Ct
- 12455 Foxglove Ct
- 12445 Foxglove Ct
- 12354 Mint Ct
- 12477 Tamarisk Dr
- 12431 Foxglove Ct
- 6749 Peach Place
- 12345 Daisy Ct
- 12348 Mint Ct
- 6759 Peach Place
- 12487 Tamarisk Dr
- 12470 Bougainvillea Way
- 12342 Mint Ct
- 6769 Peach Place
- 12339 Daisy Ct