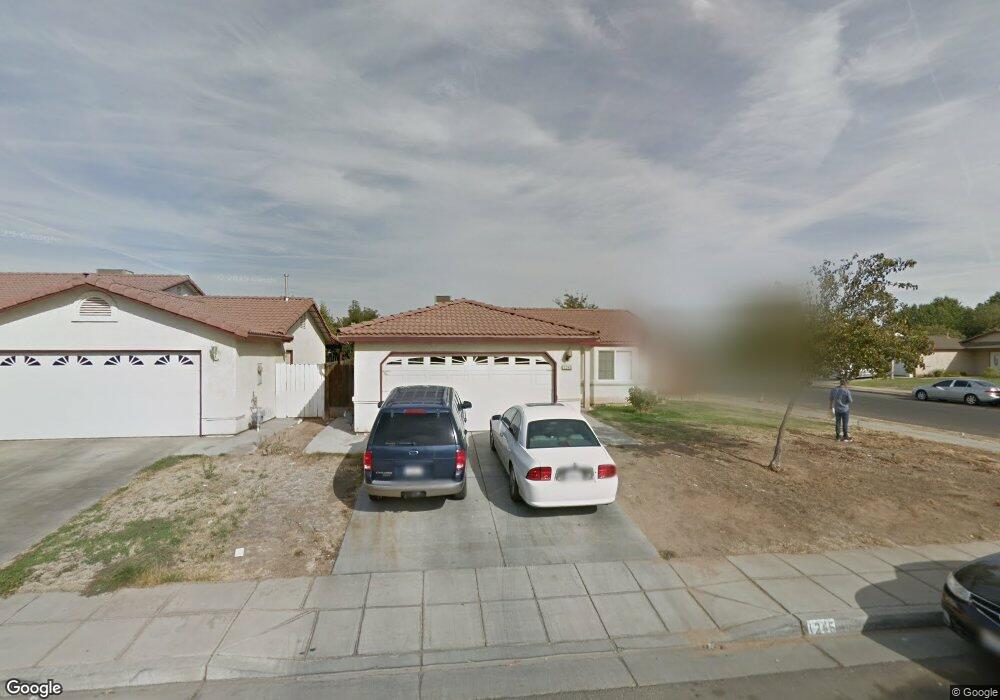
1245 Toluca Way Madera, CA 93638
North Madera NeighborhoodEstimated Value: $311,000 - $338,000
4
Beds
2
Baths
1,275
Sq Ft
$259/Sq Ft
Est. Value
About This Home
This home is located at 1245 Toluca Way, Madera, CA 93638 and is currently estimated at $330,516, approximately $259 per square foot. 1245 Toluca Way is a home located in Madera County with nearby schools including John J. Pershing Elementary School, Jack G. Desmond Middle School, and Madera South High School.
Ownership History
Date
Name
Owned For
Owner Type
Purchase Details
Closed on
Nov 28, 2006
Sold by
Esquivel Juan C Palacios and Mendoza Rosalina Hernandez
Bought by
Esquivel Juan C Palacios and Mendoza Rosalina Hernandez
Current Estimated Value
Home Financials for this Owner
Home Financials are based on the most recent Mortgage that was taken out on this home.
Original Mortgage
$35,000
Outstanding Balance
$20,995
Interest Rate
6.37%
Mortgage Type
Credit Line Revolving
Estimated Equity
$309,521
Purchase Details
Closed on
Jul 30, 2003
Sold by
H/S Development Co Llc
Bought by
Esquivel Juan C Palacios and Mendoza Rosalina Hernandez
Home Financials for this Owner
Home Financials are based on the most recent Mortgage that was taken out on this home.
Original Mortgage
$111,687
Interest Rate
5.5%
Mortgage Type
Purchase Money Mortgage
Create a Home Valuation Report for This Property
The Home Valuation Report is an in-depth analysis detailing your home's value as well as a comparison with similar homes in the area
Home Values in the Area
Average Home Value in this Area
Purchase History
| Date | Buyer | Sale Price | Title Company |
|---|---|---|---|
| Esquivel Juan C Palacios | -- | North American Title Company | |
| Esquivel Juan C Palacios | $140,000 | Chicago Title |
Source: Public Records
Mortgage History
| Date | Status | Borrower | Loan Amount |
|---|---|---|---|
| Open | Esquivel Juan C Palacios | $35,000 | |
| Previous Owner | Esquivel Juan C Palacios | $111,687 |
Source: Public Records
Tax History
| Year | Tax Paid | Tax Assessment Tax Assessment Total Assessment is a certain percentage of the fair market value that is determined by local assessors to be the total taxable value of land and additions on the property. | Land | Improvement |
|---|---|---|---|---|
| 2025 | $2,332 | $198,460 | $58,283 | $140,177 |
| 2023 | $2,332 | $190,756 | $56,021 | $134,735 |
| 2022 | $2,181 | $187,017 | $54,923 | $132,094 |
| 2021 | $2,140 | $183,351 | $53,847 | $129,504 |
| 2020 | $2,176 | $181,472 | $53,295 | $128,177 |
| 2019 | $2,077 | $170,937 | $50,205 | $120,732 |
| 2018 | $1,864 | $162,797 | $47,814 | $114,983 |
| 2017 | $1,790 | $155,045 | $45,537 | $109,508 |
| 2016 | $1,745 | $152,005 | $44,644 | $107,361 |
| 2015 | $1,659 | $144,767 | $42,518 | $102,249 |
| 2014 | $1,437 | $132,813 | $39,007 | $93,806 |
Source: Public Records
Map
Nearby Homes
- 27825 Highway 145
- 1413 Wrenwood Way
- 27592 Avenue 16
- 27594 Avenue 16
- 1218 E Cleveland Ave Unit 2
- 1218 E Cleveland Ave Unit 114
- 1218 E Cleveland Ave Unit 86
- 1218 E Cleveland Ave Unit 142
- 1218 E Cleveland Ave Unit 19
- 1218 E Cleveland Ave Unit 153
- 1218 E Cleveland Ave Unit 103
- 1218 E Cleveland Ave Unit 161
- 1218 E Cleveland Ave Unit 23
- 1218 E Cleveland Ave Unit 30
- 16134 Road 28
- 29630 California 145
- 800 Wessmith Way
- 0 E Cleveland Unit 642871
- 1105 Austin St
- 1101 Nebraska Ave
- 1263 Toluca Way
- 1250 San Sebastian Way
- 1266 San Sebastian Way
- 1287 Toluca Way
- 1244 Toluca Way
- 1310 Laguna Way
- 1318 Laguna Way
- 1262 Toluca Way
- 1282 San Sebastian Way
- 1300 Laguna Way
- 1328 Laguna Way
- 1295 Toluca Way
- 1282 Toluca Way
- 1290 Laguna Way
- 1298 San Sebastian Way
- 1338 Laguna Way
- 1292 Toluca Way
- 1247 Alicante Way
- 1280 Laguna Way
- 1251 San Sebastian Way
Your Personal Tour Guide
Ask me questions while you tour the home.