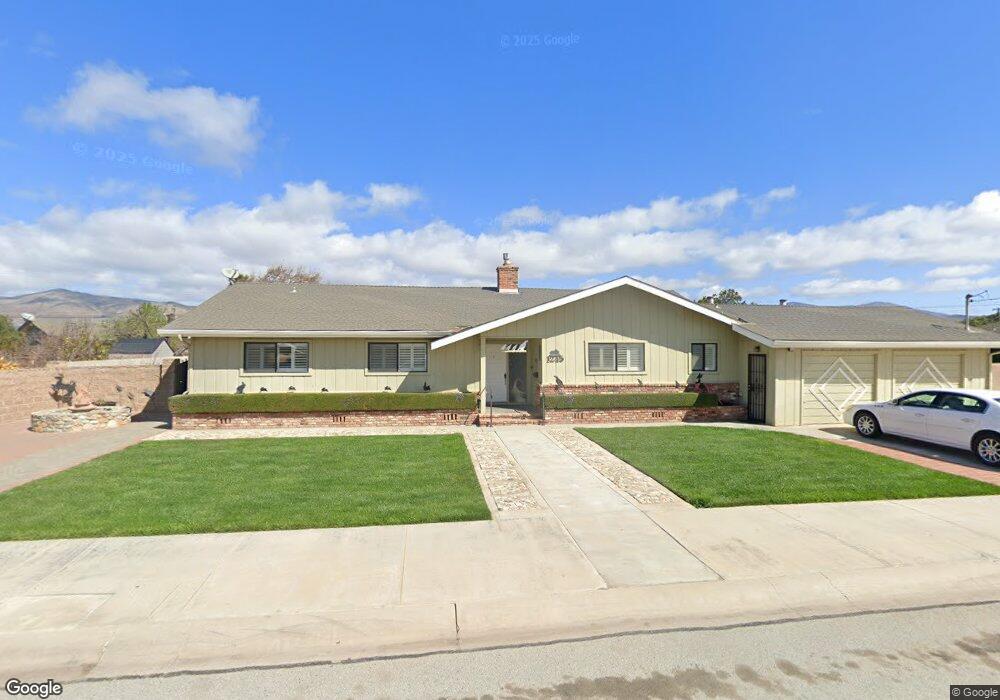
1245 Walker Dr Soledad, CA 93960
Estimated Value: $707,000 - $788,000
4
Beds
3
Baths
2,587
Sq Ft
$284/Sq Ft
Est. Value
About This Home
This home is located at 1245 Walker Dr, Soledad, CA 93960 and is currently estimated at $733,500, approximately $283 per square foot. 1245 Walker Dr is a home located in Monterey County with nearby schools including Gabilan Elementary School, Main Street Middle School, and Soledad High School.
Ownership History
Date
Name
Owned For
Owner Type
Purchase Details
Closed on
Nov 30, 2022
Sold by
Breschini Bruno Aldo
Bought by
Breschini Family Trust and Breschini
Current Estimated Value
Purchase Details
Closed on
Jan 19, 2022
Sold by
Alma J Breschini Qprt Beneficiary Trust
Bought by
Breschini Bruno Aldo
Purchase Details
Closed on
Jan 25, 2011
Sold by
Breschini Alma J and Alma J Breschini Qualified Per
Bought by
Benefici Breschini Bruno A and Benefici Alma J Breschini Qprt
Purchase Details
Closed on
Dec 12, 2001
Sold by
Breschini Bruno A and Bruno A Breschini Qualified Pe
Bought by
Benefic Breschini Alma J and Benefic Bruno A Breschini Qprt
Purchase Details
Closed on
Sep 30, 1998
Sold by
Breschini Alma J
Bought by
Breschini Alma J and Alma J Breschini Qualified Per
Create a Home Valuation Report for This Property
The Home Valuation Report is an in-depth analysis detailing your home's value as well as a comparison with similar homes in the area
Home Values in the Area
Average Home Value in this Area
Purchase History
| Date | Buyer | Sale Price | Title Company |
|---|---|---|---|
| Breschini Family Trust | -- | None Listed On Document | |
| Breschini Bruno Aldo | -- | Nicora Law Offices | |
| Breschini Bruno | -- | None Listed On Document | |
| Benefici Breschini Bruno A | -- | None Available | |
| Benefic Breschini Alma J | -- | -- | |
| Breschini Alma J | -- | -- | |
| Breschini Bruno A | -- | -- | |
| Breschini Bruno A | -- | -- | |
| Breschini Bruno | -- | -- |
Source: Public Records
Tax History
| Year | Tax Paid | Tax Assessment Tax Assessment Total Assessment is a certain percentage of the fair market value that is determined by local assessors to be the total taxable value of land and additions on the property. | Land | Improvement |
|---|---|---|---|---|
| 2025 | $1,631 | $133,863 | $18,223 | $115,640 |
| 2024 | $1,631 | $131,239 | $17,866 | $113,373 |
| 2023 | $1,479 | $128,666 | $17,516 | $111,150 |
| 2022 | $1,514 | $126,144 | $17,173 | $108,971 |
| 2021 | $1,446 | $123,672 | $16,837 | $106,835 |
| 2020 | $1,422 | $122,405 | $16,665 | $105,740 |
| 2019 | $1,389 | $120,006 | $16,339 | $103,667 |
| 2018 | $1,406 | $117,654 | $16,019 | $101,635 |
| 2017 | $1,356 | $115,348 | $15,705 | $99,643 |
| 2016 | $1,295 | $113,088 | $15,398 | $97,690 |
| 2015 | $1,274 | $111,390 | $15,167 | $96,223 |
| 2014 | $1,266 | $109,209 | $14,870 | $94,339 |
Source: Public Records
Map
Nearby Homes
- 1117 Palm Ave
- 35095 Metz Rd
- 615 Monterey St
- 570 Tankersley St
- 665 Molera Ave
- 449 Sage Ct
- 852 Mora Cir
- 836 Vasquez Dr
- 604 Gardenia Place
- 1231 Carmelo
- 715 Skinner St
- 31102 Camphora Gloria Rd
- 33900 Fabry Rd
- 31021 Camphora Rd
- 35700 Eagle Ridge
- 36527 Metz Rd
- 31462 El Camino Real
- 35422 Paraiso Springs Rd
- 41460 Los Coches Rd
- 701 El Camino Real
Your Personal Tour Guide
Ask me questions while you tour the home.