12455 SE 176th Loop Summerfield, FL 34491
Estimated Value: $405,186 - $476,000
3
Beds
3
Baths
2,077
Sq Ft
$216/Sq Ft
Est. Value
About This Home
This home is located at 12455 SE 176th Loop, Summerfield, FL 34491 and is currently estimated at $448,047, approximately $215 per square foot. 12455 SE 176th Loop is a home located in Marion County with nearby schools including Stanton-Weirsdale Elementary School, Lake Weir Middle School, and Lake Weir High School.
Ownership History
Date
Name
Owned For
Owner Type
Purchase Details
Closed on
Sep 28, 2011
Sold by
Pennington Thomas W and Pennington Billie Sue
Bought by
Pennington Thomas W and Pennington Billie Sue
Current Estimated Value
Purchase Details
Closed on
Jul 29, 2005
Sold by
A Plus Homes Inc
Bought by
Varesio John M and May Marcy
Home Financials for this Owner
Home Financials are based on the most recent Mortgage that was taken out on this home.
Original Mortgage
$150,000
Outstanding Balance
$75,336
Interest Rate
5.37%
Mortgage Type
Purchase Money Mortgage
Estimated Equity
$372,711
Purchase Details
Closed on
Sep 24, 2003
Sold by
A Plus Homes Inc
Bought by
Pennington Thomas W and Pennington Billie Sue
Home Financials for this Owner
Home Financials are based on the most recent Mortgage that was taken out on this home.
Original Mortgage
$140,000
Interest Rate
4.87%
Mortgage Type
Construction
Create a Home Valuation Report for This Property
The Home Valuation Report is an in-depth analysis detailing your home's value as well as a comparison with similar homes in the area
Home Values in the Area
Average Home Value in this Area
Purchase History
| Date | Buyer | Sale Price | Title Company |
|---|---|---|---|
| Pennington Thomas W | -- | Attorney | |
| Varesio John M | $273,900 | Superior Title | |
| Pennington Thomas W | $182,600 | Superior Title Insurance Age | |
| A Plus Homes Inc | $36,100 | Superior Title Insurance Age |
Source: Public Records
Mortgage History
| Date | Status | Borrower | Loan Amount |
|---|---|---|---|
| Open | Varesio John M | $150,000 | |
| Previous Owner | Pennington Thomas W | $140,000 |
Source: Public Records
Tax History
| Year | Tax Paid | Tax Assessment Tax Assessment Total Assessment is a certain percentage of the fair market value that is determined by local assessors to be the total taxable value of land and additions on the property. | Land | Improvement |
|---|---|---|---|---|
| 2025 | $2,863 | $198,192 | -- | -- |
| 2024 | $2,610 | $192,606 | -- | -- |
| 2023 | $2,619 | $186,996 | $0 | $0 |
| 2022 | $2,542 | $181,550 | $0 | $0 |
| 2021 | $2,537 | $176,262 | $0 | $0 |
| 2020 | $2,516 | $173,828 | $0 | $0 |
| 2019 | $2,477 | $169,920 | $0 | $0 |
| 2018 | $2,348 | $166,752 | $0 | $0 |
| 2017 | $2,304 | $163,322 | $0 | $0 |
| 2016 | $2,263 | $159,963 | $0 | $0 |
| 2015 | $2,276 | $158,851 | $0 | $0 |
| 2014 | $2,141 | $157,590 | $0 | $0 |
Source: Public Records
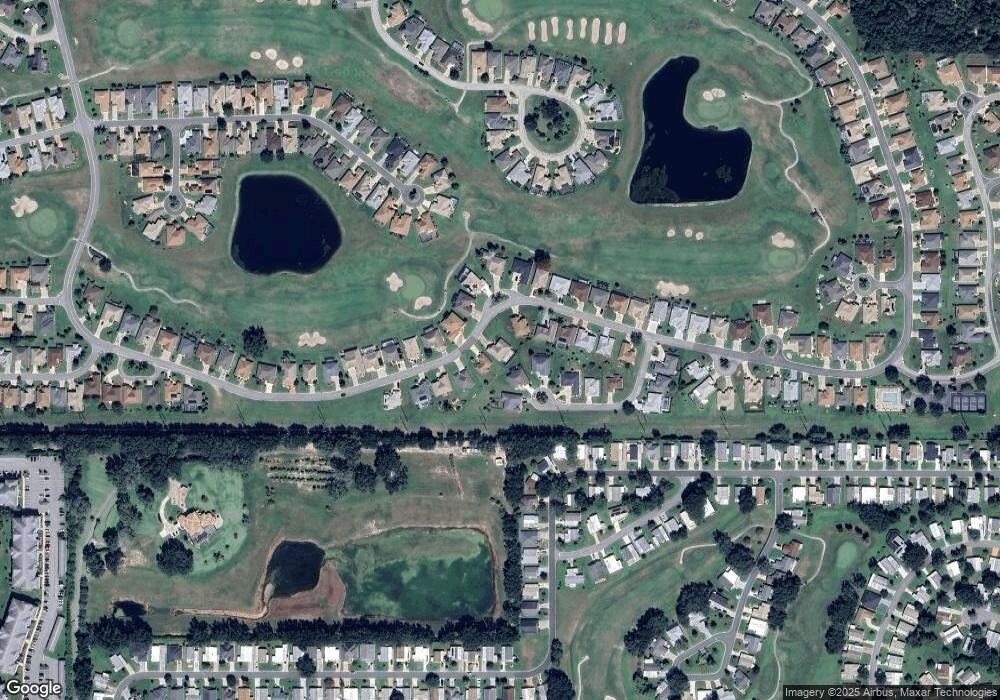
Map
Nearby Homes
- 12459 SE 176th Loop
- 1763 W Schwartz Blvd
- 17974 SE 123rd Terrace
- 12420 SE 176th Loop
- 1751 W Schwartz Blvd
- 12384 SE 176th Loop
- 12104 SE 178th St
- 1805 Kaufman Cir
- 12095 SE 178th St
- 1729 Lauren Ln
- 12321 SE 176th Loop
- 1717 Lilly Ln
- 17680 SE 121st Ct
- 17974 SE 115th Cir
- 12163 SE 176th Loop
- 1710 Lilly Ln
- 17786 SE 119th Avenue Rd Unit 2
- 1732 Magnolia Ave
- 11900 SE 178th St
- 953 Orchid St
- 12439 SE 176th Loop
- 17992 SE 123rd Terrace
- 12425 SE 176th Loop
- 12458 SE 176th Loop
- 12458 SE 176 Loop
- 17986 SE 123rd Terrace
- 12454 SE 176th Loop
- 12461 SE 176th Loop
- 12462 SE 176th Loop
- 17998 SE 123rd Terrace
- 12419 SE 176th Loop
- 12450 SE 176th Loop
- 12465 Se Loop
- 12465 SE 176th Loop
- 17980 SE 123rd Terrace
- 12438 SE 176th Loop
- 12432 SE 176th Loop
- 12444 SE 176th Loop
- 12413 SE 176th Loop
- 12466 SE 176th Loop
Your Personal Tour Guide
Ask me questions while you tour the home.