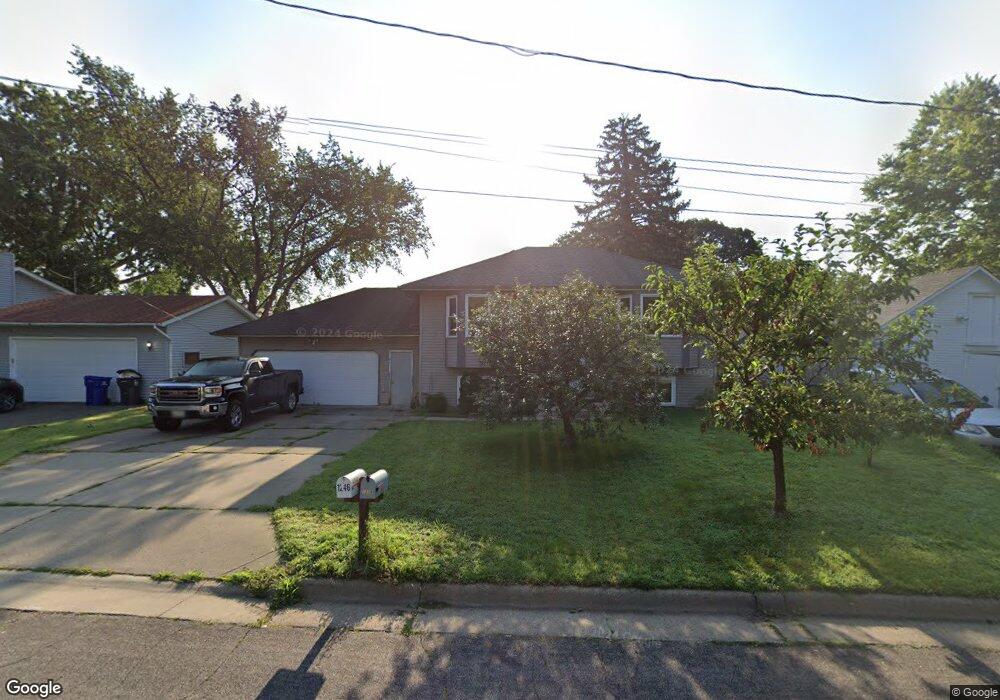
1246 Clark St Saint Paul, MN 55130
Payne-Phalen NeighborhoodEstimated Value: $276,000 - $344,000
4
Beds
2
Baths
938
Sq Ft
$316/Sq Ft
Est. Value
About This Home
This home is located at 1246 Clark St, Saint Paul, MN 55130 and is currently estimated at $296,764, approximately $316 per square foot. 1246 Clark St is a home located in Ramsey County with nearby schools including Bruce F Vento Elementary School, Uncommon Schools Camden Prep - Mt. Ephraim Campus, and Washington Technology Magnet School.
Ownership History
Date
Name
Owned For
Owner Type
Purchase Details
Closed on
Dec 29, 2016
Sold by
Federal Home Loan Mortgage Corporation
Bought by
Kue Chia and Kue Yer Y
Current Estimated Value
Home Financials for this Owner
Home Financials are based on the most recent Mortgage that was taken out on this home.
Original Mortgage
$178,703
Outstanding Balance
$147,310
Interest Rate
4.13%
Mortgage Type
FHA
Estimated Equity
$149,454
Purchase Details
Closed on
Nov 21, 2014
Sold by
Citimortgage Inc
Bought by
Federal Home Loan Mortgage Corporation
Purchase Details
Closed on
Oct 29, 2014
Sold by
Vang Kou and Yang Xia
Bought by
Citimortgage Inc
Purchase Details
Closed on
Aug 29, 2003
Sold by
Moua You Zong and Yang Va
Bought by
Vang Kou and Yang Xia
Purchase Details
Closed on
Aug 10, 2001
Sold by
Thao Chai N and Thao Cellan C
Bought by
Moua You Z and Yang Va
Create a Home Valuation Report for This Property
The Home Valuation Report is an in-depth analysis detailing your home's value as well as a comparison with similar homes in the area
Home Values in the Area
Average Home Value in this Area
Purchase History
| Date | Buyer | Sale Price | Title Company |
|---|---|---|---|
| Kue Chia | -- | Title One Inc | |
| Federal Home Loan Mortgage Corporation | -- | None Available | |
| Citimortgage Inc | $120,453 | None Available | |
| Vang Kou | $214,000 | -- | |
| Moua You Z | $25,000 | -- |
Source: Public Records
Mortgage History
| Date | Status | Borrower | Loan Amount |
|---|---|---|---|
| Open | Kue Chia | $178,703 |
Source: Public Records
Tax History Compared to Growth
Tax History
| Year | Tax Paid | Tax Assessment Tax Assessment Total Assessment is a certain percentage of the fair market value that is determined by local assessors to be the total taxable value of land and additions on the property. | Land | Improvement |
|---|---|---|---|---|
| 2025 | $3,844 | $304,900 | $30,000 | $274,900 |
| 2023 | $3,844 | $256,800 | $25,000 | $231,800 |
| 2022 | $4,322 | $292,300 | $25,000 | $267,300 |
| 2021 | $3,670 | $260,700 | $25,000 | $235,700 |
| 2020 | $3,658 | $232,800 | $15,300 | $217,500 |
| 2019 | $3,466 | $204,600 | $15,300 | $189,300 |
| 2018 | $2,940 | $201,300 | $15,300 | $186,000 |
| 2017 | $3,106 | $175,000 | $15,300 | $159,700 |
| 2016 | $3,190 | $0 | $0 | $0 |
| 2015 | $2,672 | $169,100 | $15,300 | $153,800 |
| 2014 | $2,476 | $0 | $0 | $0 |
Source: Public Records
Map
Nearby Homes
- 1244 Burr St
- 419 Rose Ave E
- 1192 Burr St
- 1158 Bradley St
- 1195 Edgerton St
- 1174 Edgerton St
- 602 Ivy Ave E
- 1105 Jessie St
- 617 Maryland Ave E
- 514 Arlington Ave E
- 1268 Payne Ave
- 858 Burr St N
- 1415 Payne Ave
- 1039 Edgerton St
- 387 Jenks Ave
- 654 Jessamine Ave E
- 673 Jessamine Ave E
- 1436 Payne Ave
- 620 Cook Ave E
- 324 Jenks Ave
- 1258 Clark St
- 447 Brainerd Ave
- 433 Brainerd Ave
- 431 Brainerd Ave
- 1262 Clark St
- 1253 1253 Clark-Street-
- 1249 Clark St
- 1253 Clark St
- 457 Brainerd Ave
- 1243 Clark St
- 442 442 Brainerd Ave
- 1266 Clark St
- 1257 Clark St
- 1255 Desoto St
- 1239 1239 Clark-Street-
- 1239 Clark St
- 1263 Clark St
- 1272 Clark St
- 1265 Desoto St
- 1259 Desoto St