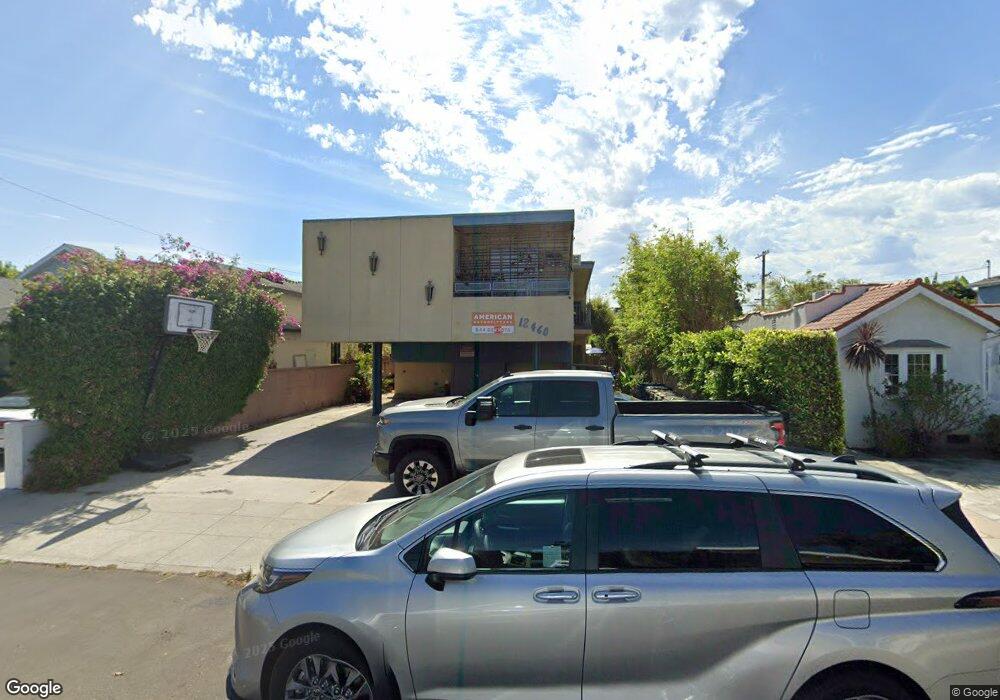
12460 Gilmore Ave Los Angeles, CA 90066
Del Rey NeighborhoodEstimated Value: $1,481,000 - $3,279,000
7
Beds
5
Baths
3,679
Sq Ft
$578/Sq Ft
Est. Value
About This Home
This home is located at 12460 Gilmore Ave, Los Angeles, CA 90066 and is currently estimated at $2,125,667, approximately $577 per square foot. 12460 Gilmore Ave is a home located in Los Angeles County with nearby schools including Short Avenue Elementary School, Marina Del Rey Middle School, and Venice High School.
Ownership History
Date
Name
Owned For
Owner Type
Purchase Details
Closed on
Jan 7, 2011
Sold by
Takayama Gordon K
Bought by
Albrecht Susan and Takayama Gordon
Current Estimated Value
Home Financials for this Owner
Home Financials are based on the most recent Mortgage that was taken out on this home.
Original Mortgage
$539,000
Outstanding Balance
$361,268
Interest Rate
4.43%
Mortgage Type
New Conventional
Estimated Equity
$1,764,399
Purchase Details
Closed on
Jan 12, 2010
Sold by
Albrecht Susan A
Bought by
Takayama Gordon K
Home Financials for this Owner
Home Financials are based on the most recent Mortgage that was taken out on this home.
Original Mortgage
$300,000
Interest Rate
4.78%
Mortgage Type
Stand Alone First
Purchase Details
Closed on
Feb 15, 1995
Sold by
Omalley John M
Bought by
Takayama Kameyoshi
Home Financials for this Owner
Home Financials are based on the most recent Mortgage that was taken out on this home.
Original Mortgage
$216,000
Interest Rate
9.21%
Create a Home Valuation Report for This Property
The Home Valuation Report is an in-depth analysis detailing your home's value as well as a comparison with similar homes in the area
Home Values in the Area
Average Home Value in this Area
Purchase History
| Date | Buyer | Sale Price | Title Company |
|---|---|---|---|
| Albrecht Susan | -- | Fidelity National Title Co | |
| Takayama Gordon K | -- | Fidelity Van Nuys | |
| Takayama Kameyoshi | $270,000 | Commonwealth Land Title Co |
Source: Public Records
Mortgage History
| Date | Status | Borrower | Loan Amount |
|---|---|---|---|
| Open | Albrecht Susan | $539,000 | |
| Closed | Takayama Gordon K | $300,000 | |
| Closed | Takayama Kameyoshi | $216,000 |
Source: Public Records
Tax History Compared to Growth
Tax History
| Year | Tax Paid | Tax Assessment Tax Assessment Total Assessment is a certain percentage of the fair market value that is determined by local assessors to be the total taxable value of land and additions on the property. | Land | Improvement |
|---|---|---|---|---|
| 2025 | $5,789 | $453,497 | $251,944 | $201,553 |
| 2024 | $5,789 | $444,605 | $247,004 | $197,601 |
| 2023 | $5,687 | $435,888 | $242,161 | $193,727 |
| 2022 | $5,437 | $427,342 | $237,413 | $189,929 |
| 2021 | $5,349 | $418,963 | $232,758 | $186,205 |
| 2019 | $5,195 | $406,538 | $225,855 | $180,683 |
| 2018 | $5,122 | $398,568 | $221,427 | $177,141 |
| 2016 | $4,866 | $383,093 | $212,830 | $170,263 |
| 2015 | $4,798 | $377,340 | $209,634 | $167,706 |
| 2014 | $4,840 | $369,949 | $205,528 | $164,421 |
Source: Public Records
Map
Nearby Homes
- 12445 Greene Ave
- 12479 Walsh Ave
- 4546 S Centinela Ave
- 12520 Gilmore Ave
- 12534 Gilmore Ave
- 12537 Rubens Ave
- 12531 Culver Blvd
- 4410 Stewart Ave
- 12616 Bonaparte Ave
- 4316 Westlawn Ave
- 12441 Verdi St
- 4632 Marshall Dr
- 4220 Kenyon Ave
- 12056 Culver Blvd
- 4430 Lindblade Dr
- 4266 Grand View Blvd
- 4852 S Centinela Ave
- 4242 Grand View Blvd
- 4373 Mcconnell Blvd
- 12837 Bonaparte Ave
- 12464 Gilmore Ave
- 12456 Gilmore Ave
- 12450 Gilmore Ave
- 12466 Gilmore Ave
- 12448 Gilmore Ave
- 12472 Gilmore Ave
- 12465 Greene Ave
- 12473 Greene Ave
- 12461 Greene Ave
- 12477 Greene Ave
- 12444 Gilmore Ave
- 12476 Gilmore Ave
- 12461 Gilmore Ave
- 12457 Gilmore Ave
- 12465 Gilmore Ave
- 12457 Greene Ave
- 12481 Greene Ave
- 12453 Gilmore Ave
- 12469 Gilmore Ave
- 12449 Gilmore Ave