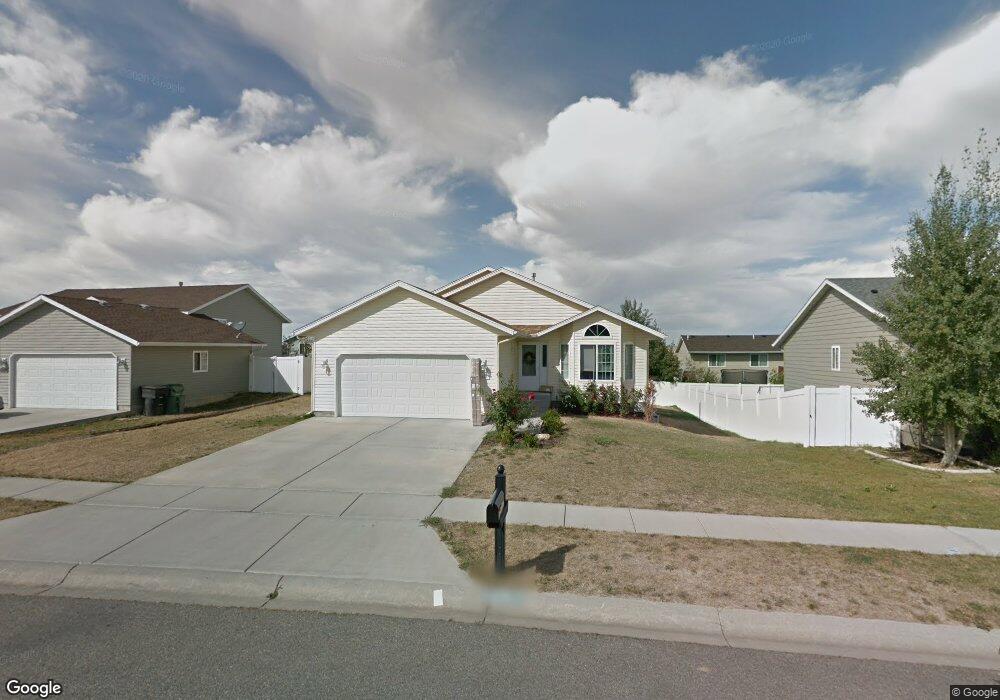
1247 Cortez Ave Billings, MT 59105
Billings Heights NeighborhoodEstimated Value: $363,655 - $419,000
5
Beds
3
Baths
1,168
Sq Ft
$340/Sq Ft
Est. Value
About This Home
This home is located at 1247 Cortez Ave, Billings, MT 59105 and is currently estimated at $396,664, approximately $339 per square foot. 1247 Cortez Ave is a home located in Yellowstone County with nearby schools including Eagle Cliffs Elementary School, Castle Rock Junior High School, and Skyview High School.
Ownership History
Date
Name
Owned For
Owner Type
Purchase Details
Closed on
Jan 1, 2018
Sold by
Optionen Llc
Bought by
Boom Farm Llc
Current Estimated Value
Purchase Details
Closed on
Dec 13, 2016
Sold by
Pearson Jamie L
Bought by
Optionen Llc
Purchase Details
Closed on
May 26, 2016
Sold by
Optionen Llc
Bought by
Pearson Jamie L
Purchase Details
Closed on
Jun 8, 2012
Sold by
Dews Richard G and Dews Jane A
Bought by
Optionen Llc
Purchase Details
Closed on
Oct 2, 2006
Sold by
Dawson Builders Inc
Bought by
Dews Richard G and Dews Jane A
Home Financials for this Owner
Home Financials are based on the most recent Mortgage that was taken out on this home.
Original Mortgage
$182,244
Interest Rate
6.53%
Mortgage Type
New Conventional
Purchase Details
Closed on
May 8, 2006
Sold by
High Sierra Ii Inc
Bought by
Dawson Builders Inc
Create a Home Valuation Report for This Property
The Home Valuation Report is an in-depth analysis detailing your home's value as well as a comparison with similar homes in the area
Home Values in the Area
Average Home Value in this Area
Purchase History
| Date | Buyer | Sale Price | Title Company |
|---|---|---|---|
| Boom Farm Llc | -- | None Available | |
| Optionen Llc | -- | None Available | |
| Pearson Jamie L | -- | First Montana Title | |
| Optionen Llc | $156,001 | None Available | |
| Dews Richard G | -- | Stewart Title Of Billings | |
| Dawson Builders Inc | -- | None Available |
Source: Public Records
Mortgage History
| Date | Status | Borrower | Loan Amount |
|---|---|---|---|
| Previous Owner | Dews Richard G | $182,244 |
Source: Public Records
Tax History Compared to Growth
Tax History
| Year | Tax Paid | Tax Assessment Tax Assessment Total Assessment is a certain percentage of the fair market value that is determined by local assessors to be the total taxable value of land and additions on the property. | Land | Improvement |
|---|---|---|---|---|
| 2025 | $3,410 | $415,300 | $68,306 | $346,994 |
| 2024 | $3,410 | $351,800 | $64,178 | $287,622 |
| 2023 | $3,398 | $351,800 | $64,178 | $287,622 |
| 2022 | $2,902 | $262,400 | $0 | $0 |
| 2021 | $2,761 | $262,400 | $0 | $0 |
| 2020 | $2,714 | $244,800 | $0 | $0 |
| 2019 | $2,591 | $244,800 | $0 | $0 |
| 2018 | $2,569 | $238,400 | $0 | $0 |
| 2017 | $2,489 | $238,400 | $0 | $0 |
| 2016 | $2,315 | $219,600 | $0 | $0 |
| 2015 | $2,219 | $219,600 | $0 | $0 |
| 2014 | $1,993 | $104,410 | $0 | $0 |
Source: Public Records
Map
Nearby Homes
- 1253 Matador Ave
- 1310 Cortez Ave
- 1337 Matador Ave
- 1193 El Rancho Dr
- 1134 Vera Cruz Cir
- 1355 Matador Ave
- 1339 Benjamin Blvd
- 1351 Matador Cir
- 1414 Benjamin Blvd
- 2233 Sierra Vista Cir
- 2218 Modera Ave
- 941 Ortega St
- 997 Matador Ave
- 907 Presidio Ln
- 2237 Lindero Blvd
- 2238 Lindero Blvd
- 2250 Lindero Blvd
- 1029 Picador Way
- 2107 Morocco Dr
- 2142 Gleneagles Blvd
- 1243 Cortez Ave
- 1251 Cortez Ave
- 1244 Matador Ave
- 1240 Matador Ave
- 1248 Matador Ave
- 1239 Cortez Ave
- 1255 Cortez Ave
- 1246 Cortez Ave
- 1236 Matador Ave
- 1252 Matador Ave
- 1242 Cortez Ave
- 1250 Cortez Ave
- 1259 Cortez Ave
- 1235 Cortez Ave
- 1238 Cortez Ave
- 1254 Cortez Ave
- 1232 Matador Ave
- 1256 Matador Ave
- 1245 Sierra Granda Blvd
- 1241 Matador Ave