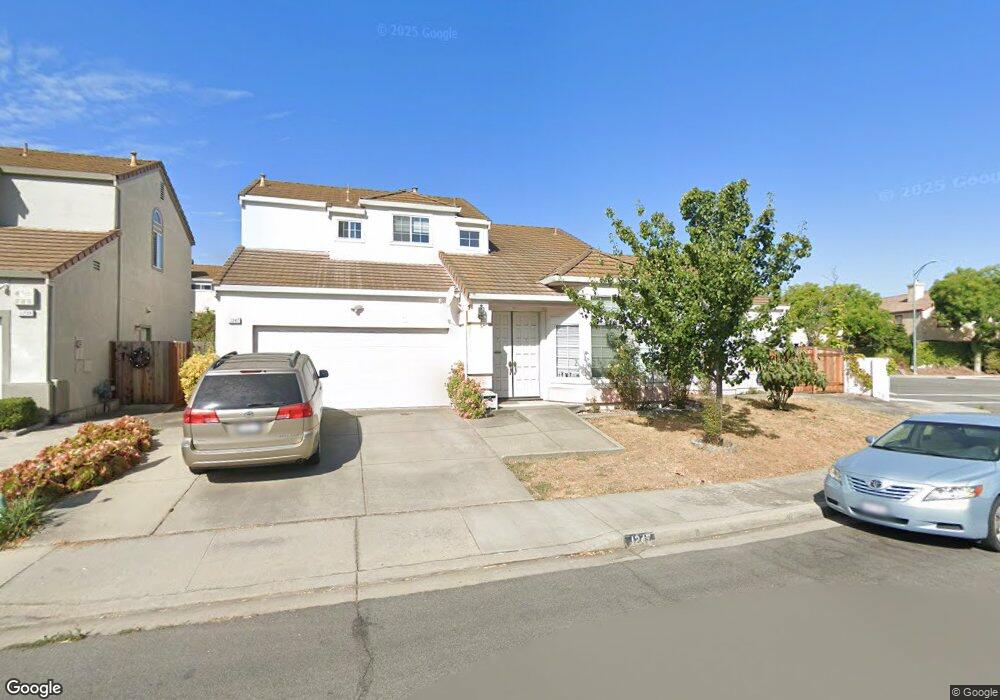
1247 Summerwind Way Milpitas, CA 95035
Estimated Value: $1,795,000 - $2,133,000
6
Beds
4
Baths
1,886
Sq Ft
$1,026/Sq Ft
Est. Value
About This Home
This home is located at 1247 Summerwind Way, Milpitas, CA 95035 and is currently estimated at $1,935,284, approximately $1,026 per square foot. 1247 Summerwind Way is a home located in Santa Clara County with nearby schools including Marshall Pomeroy Elementary School, Thomas Russell Middle School, and Milpitas High School.
Ownership History
Date
Name
Owned For
Owner Type
Purchase Details
Closed on
Nov 16, 2006
Sold by
Jivan Vinay C and Jivan Damini
Bought by
Miao Yaohua and Hsu Wanchi
Current Estimated Value
Home Financials for this Owner
Home Financials are based on the most recent Mortgage that was taken out on this home.
Original Mortgage
$637,500
Outstanding Balance
$407,121
Interest Rate
7.67%
Mortgage Type
Negative Amortization
Estimated Equity
$1,528,163
Purchase Details
Closed on
Mar 11, 1996
Sold by
Sparkman Debbie
Bought by
Jivan Vinay C and Jivan Damini
Home Financials for this Owner
Home Financials are based on the most recent Mortgage that was taken out on this home.
Original Mortgage
$207,000
Interest Rate
7.12%
Purchase Details
Closed on
Jul 30, 1994
Sold by
Newberry Tim
Bought by
Sparkman Debbie
Create a Home Valuation Report for This Property
The Home Valuation Report is an in-depth analysis detailing your home's value as well as a comparison with similar homes in the area
Home Values in the Area
Average Home Value in this Area
Purchase History
| Date | Buyer | Sale Price | Title Company |
|---|---|---|---|
| Miao Yaohua | $850,000 | Commonwealth Land Title Co | |
| Jivan Vinay C | $300,000 | Old Republic Title Company | |
| Sparkman Debbie | -- | -- |
Source: Public Records
Mortgage History
| Date | Status | Borrower | Loan Amount |
|---|---|---|---|
| Open | Miao Yaohua | $637,500 | |
| Previous Owner | Jivan Vinay C | $207,000 | |
| Closed | Jivan Vinay C | $33,000 |
Source: Public Records
Tax History
| Year | Tax Paid | Tax Assessment Tax Assessment Total Assessment is a certain percentage of the fair market value that is determined by local assessors to be the total taxable value of land and additions on the property. | Land | Improvement |
|---|---|---|---|---|
| 2025 | $12,949 | $1,138,804 | $569,402 | $569,402 |
| 2024 | $12,949 | $1,116,476 | $558,238 | $558,238 |
| 2023 | $12,907 | $1,094,586 | $547,293 | $547,293 |
| 2022 | $12,852 | $1,073,124 | $536,562 | $536,562 |
| 2021 | $12,665 | $1,052,084 | $526,042 | $526,042 |
| 2020 | $12,443 | $1,041,298 | $520,649 | $520,649 |
| 2019 | $12,300 | $1,020,882 | $510,441 | $510,441 |
| 2018 | $11,675 | $1,000,866 | $500,433 | $500,433 |
| 2017 | $11,523 | $981,242 | $490,621 | $490,621 |
| 2016 | $11,059 | $962,002 | $481,001 | $481,001 |
| 2015 | $10,945 | $947,552 | $473,776 | $473,776 |
| 2014 | $10,659 | $928,992 | $464,496 | $464,496 |
Source: Public Records
Map
Nearby Homes
- 1279 Milkweed St
- 1200 N Abbott Ave Unit 200
- 1357 California Cir
- 1363 Lilac Way
- 622 Chamise Way
- 1357 Lilac Way
- 1359 Lilac Way
- 1361 Lilac Way
- 1355 Lilac Way
- 1359 California Cir
- 1087 N Abbott Ave
- 1006 N Abbott Ave
- 1008 N Abbott Ave
- 60 Jacklin Place
- 210 Sunnyhills Ct Unit 10
- 513 Glenmoor Cir
- 207 Redwood Ave
- 472 Glenmoor Cir
- 527 Maple Ave
- 60 Wilson Way Unit 104
- 1239 Summerwind Way
- 1230 Seaside Way
- 1231 Summerwind Way
- 1222 Seaside Way
- 1304 Elkwood Dr
- 1223 Summerwind Way
- 1298 Elkwood Dr
- 1310 Elkwood Dr
- 1214 Seaside Way
- 1292 Elkwood Dr
- 1316 Elkwood Dr
- 1286 Elkwood Dr
- 1322 Elkwood Dr
- 199 Balboa Dr
- 1280 Elkwood Dr
- 1328 Elkwood Dr
- 1207 Summerwind Way
- 1198 Seaside Way
- 1334 Elkwood Dr
- 207 Balboa Dr
Your Personal Tour Guide
Ask me questions while you tour the home.