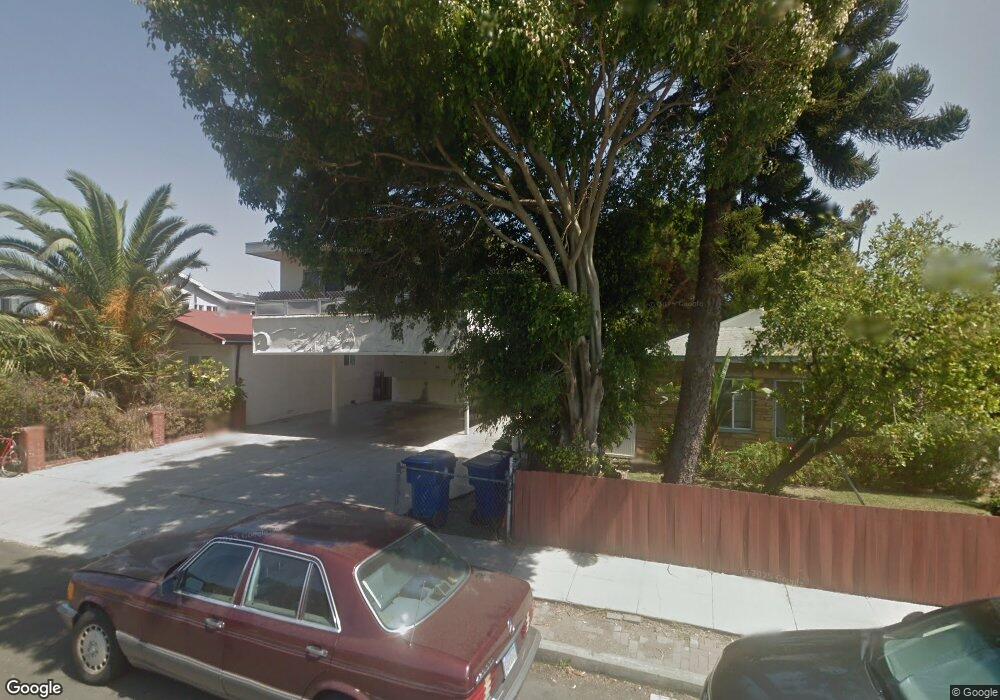
12476 Gilmore Ave Los Angeles, CA 90066
Del Rey NeighborhoodEstimated Value: $1,442,000 - $3,279,000
7
Beds
5
Baths
3,622
Sq Ft
$583/Sq Ft
Est. Value
About This Home
This home is located at 12476 Gilmore Ave, Los Angeles, CA 90066 and is currently estimated at $2,112,667, approximately $583 per square foot. 12476 Gilmore Ave is a home located in Los Angeles County with nearby schools including Short Avenue Elementary School, Marina Del Rey Middle School, and Venice High School.
Ownership History
Date
Name
Owned For
Owner Type
Purchase Details
Closed on
Aug 29, 2021
Sold by
Alcantara Nepomuceno Elmer
Bought by
Melinda Catudan Nepomuceno 2013 Trust and Nepomuceno
Current Estimated Value
Purchase Details
Closed on
Nov 26, 2018
Sold by
Bryant Melissa R
Bought by
Bryant Melissa R and Melissa R Bryant 2018 Trust
Purchase Details
Closed on
Nov 14, 2018
Sold by
Nepomuceno Melinda C
Bought by
Catudan Nepomuceno Melinda and Catudan Melinda Nepomuceno 201
Purchase Details
Closed on
Jul 12, 2006
Sold by
Catudan Pedro B
Bought by
Catudan Pedro B and Catudan Melecia R
Purchase Details
Closed on
Mar 13, 2002
Sold by
Catudan Pedro B
Bought by
Catudan Pedro B and Catudan Melecia R
Home Financials for this Owner
Home Financials are based on the most recent Mortgage that was taken out on this home.
Original Mortgage
$155,000
Interest Rate
6.85%
Purchase Details
Closed on
Nov 13, 1997
Sold by
Catudan Pedro
Bought by
Catudan Pedro B and Catudan Melecia R
Create a Home Valuation Report for This Property
The Home Valuation Report is an in-depth analysis detailing your home's value as well as a comparison with similar homes in the area
Home Values in the Area
Average Home Value in this Area
Purchase History
| Date | Buyer | Sale Price | Title Company |
|---|---|---|---|
| Melinda Catudan Nepomuceno 2013 Trust | -- | None Listed On Document | |
| Bryant Melissa R | -- | None Available | |
| Catudan Nepomuceno Melinda | -- | None Available | |
| Catudan Pedro B | -- | None Available | |
| Catudan Pedro B | -- | None Available | |
| Catudan Pedro B | -- | American Coast Title Company | |
| Catudan Pedro B | -- | -- |
Source: Public Records
Mortgage History
| Date | Status | Borrower | Loan Amount |
|---|---|---|---|
| Previous Owner | Catudan Pedro B | $155,000 |
Source: Public Records
Tax History Compared to Growth
Tax History
| Year | Tax Paid | Tax Assessment Tax Assessment Total Assessment is a certain percentage of the fair market value that is determined by local assessors to be the total taxable value of land and additions on the property. | Land | Improvement |
|---|---|---|---|---|
| 2025 | $6,057 | $476,727 | $260,035 | $216,692 |
| 2024 | $6,057 | $467,381 | $254,937 | $212,444 |
| 2023 | $5,950 | $458,218 | $249,939 | $208,279 |
| 2022 | $5,687 | $449,235 | $245,039 | $204,196 |
| 2021 | $5,596 | $440,428 | $240,235 | $200,193 |
| 2020 | $5,648 | $1,625,000 | $1,100,000 | $525,000 |
| 2019 | $5,435 | $427,366 | $233,110 | $194,256 |
| 2018 | $5,363 | $418,988 | $228,540 | $190,448 |
| 2016 | $5,098 | $402,719 | $219,666 | $183,053 |
| 2015 | $5,026 | $396,671 | $216,367 | $180,304 |
| 2014 | $5,069 | $388,902 | $212,129 | $176,773 |
Source: Public Records
Map
Nearby Homes
- 12520 Gilmore Ave
- 12534 Gilmore Ave
- 12479 Walsh Ave
- 12445 Greene Ave
- 4410 Stewart Ave
- 12537 Rubens Ave
- 12616 Bonaparte Ave
- 12531 Culver Blvd
- 4546 S Centinela Ave
- 4316 Westlawn Ave
- 4220 Kenyon Ave
- 12441 Verdi St
- 4373 Mcconnell Blvd
- 12836 Gilmore Ave
- 12837 Bonaparte Ave
- 4266 Grand View Blvd
- 4632 Marshall Dr
- 12870 Walsh Ave
- 12850 Admiral Ave
- 4242 Grand View Blvd
- 12472 Gilmore Ave
- 12478 Gilmore Ave
- 12466 Gilmore Ave
- 12484 Gilmore Ave
- 12464 Gilmore Ave
- 12488 Gilmore Ave Unit 4
- 12488 Gilmore Ave Unit 3
- 12488 Gilmore Ave Unit 2
- 12488 Gilmore Ave Unit C
- 12488 Gilmore Ave Unit D
- 12488 Gilmore Ave
- 12483 Greene Ave
- 12481 Greene Ave
- 12487 Greene Ave
- 12477 Greene Ave
- 12493 Greene Ave
- 12492 Gilmore Ave Unit 1
- 12492 Gilmore Ave Unit 4
- 12492 Gilmore Ave
- 12460 Gilmore Ave