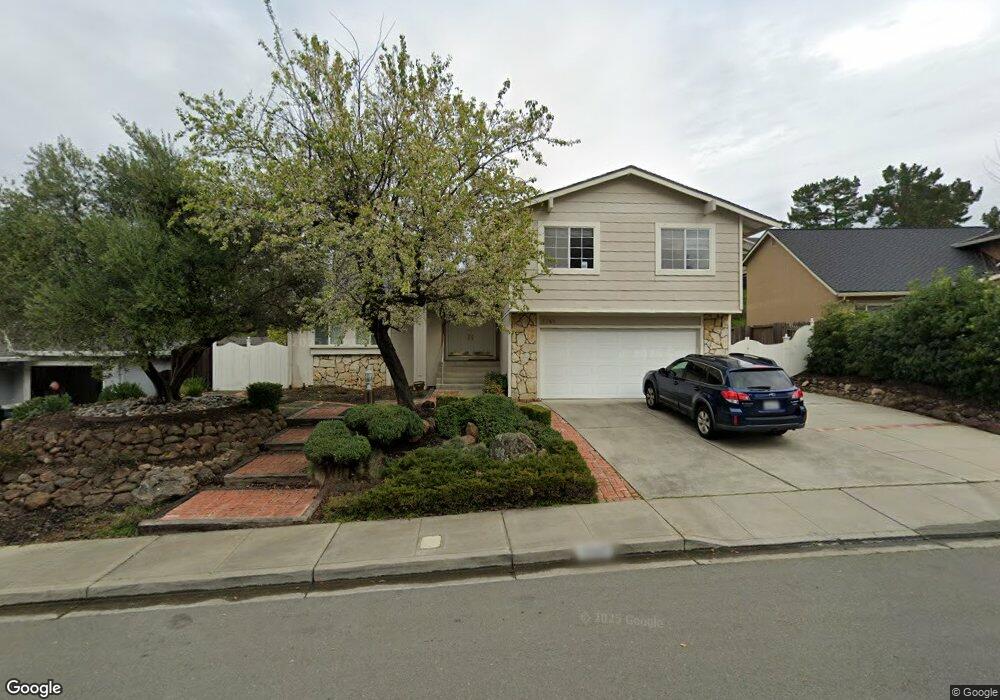
1248 Bordeaux St Pleasanton, CA 94566
Vintage Hills NeighborhoodEstimated Value: $1,681,000 - $2,146,577
4
Beds
3
Baths
2,469
Sq Ft
$803/Sq Ft
Est. Value
About This Home
This home is located at 1248 Bordeaux St, Pleasanton, CA 94566 and is currently estimated at $1,981,394, approximately $802 per square foot. 1248 Bordeaux St is a home located in Alameda County with nearby schools including Vintage Hills Elementary School, Pleasanton Middle School, and Amador Valley High School.
Ownership History
Date
Name
Owned For
Owner Type
Purchase Details
Closed on
Nov 20, 2020
Sold by
Sapre Vaidehi and Sapre Vaidehi V
Bought by
Sapre Vivek and Sapre Vaidehi V
Current Estimated Value
Home Financials for this Owner
Home Financials are based on the most recent Mortgage that was taken out on this home.
Original Mortgage
$688,000
Outstanding Balance
$612,222
Interest Rate
2.8%
Mortgage Type
New Conventional
Estimated Equity
$1,369,172
Purchase Details
Closed on
May 30, 2017
Sold by
Rude Lester Raymond and Rude Mary Ann
Bought by
Sapre Vivek Vijaykumar and Sapre Valdehi Vivek
Home Financials for this Owner
Home Financials are based on the most recent Mortgage that was taken out on this home.
Original Mortgage
$750,000
Interest Rate
4.03%
Mortgage Type
New Conventional
Create a Home Valuation Report for This Property
The Home Valuation Report is an in-depth analysis detailing your home's value as well as a comparison with similar homes in the area
Home Values in the Area
Average Home Value in this Area
Purchase History
| Date | Buyer | Sale Price | Title Company |
|---|---|---|---|
| Sapre Vivek | -- | Fidelity National Title | |
| Sapre Vivek Vijaykumar | $1,300,000 | Old Republic Title Company |
Source: Public Records
Mortgage History
| Date | Status | Borrower | Loan Amount |
|---|---|---|---|
| Open | Sapre Vivek | $688,000 | |
| Closed | Sapre Vivek Vijaykumar | $750,000 |
Source: Public Records
Tax History Compared to Growth
Tax History
| Year | Tax Paid | Tax Assessment Tax Assessment Total Assessment is a certain percentage of the fair market value that is determined by local assessors to be the total taxable value of land and additions on the property. | Land | Improvement |
|---|---|---|---|---|
| 2025 | $17,307 | $1,501,727 | $452,618 | $1,056,109 |
| 2024 | $17,307 | $1,472,152 | $443,745 | $1,035,407 |
| 2023 | $17,109 | $1,450,150 | $435,045 | $1,015,105 |
| 2022 | $16,205 | $1,414,718 | $426,515 | $995,203 |
| 2021 | $15,789 | $1,386,846 | $418,154 | $975,692 |
| 2020 | $15,587 | $1,379,560 | $413,868 | $965,692 |
| 2019 | $15,777 | $1,352,520 | $405,756 | $946,764 |
| 2018 | $15,458 | $1,326,000 | $397,800 | $928,200 |
| 2017 | $2,820 | $243,113 | $59,329 | $183,784 |
| 2016 | $2,598 | $238,347 | $58,166 | $180,181 |
| 2015 | $2,550 | $234,767 | $57,292 | $177,475 |
| 2014 | $2,592 | $230,169 | $56,170 | $173,999 |
Source: Public Records
Map
Nearby Homes
- 3379 Arbor Dr
- 3550 Arbor Ct
- 1312 Vintner Way
- 3249 Arbor Dr
- 3134 Arbor Dr
- 3126 Arbor Dr
- 974 Clinton Place
- 665 Palomino Dr Unit D
- 601 Palomino Dr Unit C
- 3399 Norton Way Unit 6
- 3375 Norton Way Unit 5
- 543 Tawny Dr
- 786 Bonita Ave
- 2947 Chardonnay Dr
- 389 Mavis Dr
- 789 E Angela St
- 3231 Vineyard Ave Unit 126
- 3231 Vineyard Ave Unit 29
- 3231 Vineyard Ave Unit 33
- 3231 Vineyard Ave Unit 132
- 1262 Bordeaux St
- 1220 Bordeaux St
- 1276 Bordeaux St
- 1296 Chianti Ct
- 1255 Bordeaux St
- 1206 Bordeaux St
- 1272 Chianti Ct
- 1273 Bordeaux St
- 1260 Chianti Ct
- 1231 Bordeaux St
- 1290 Bordeaux St
- 3475 Brandy Ct
- 3408 Bordeaux Place
- 1284 Chianti Ct
- 1248 Chianti Ct
- 1295 Bordeaux St
- 1236 Chianti Ct
- 3446 Bordeaux Place
- 3441 Brandy Ct
- 1194 Bordeaux St