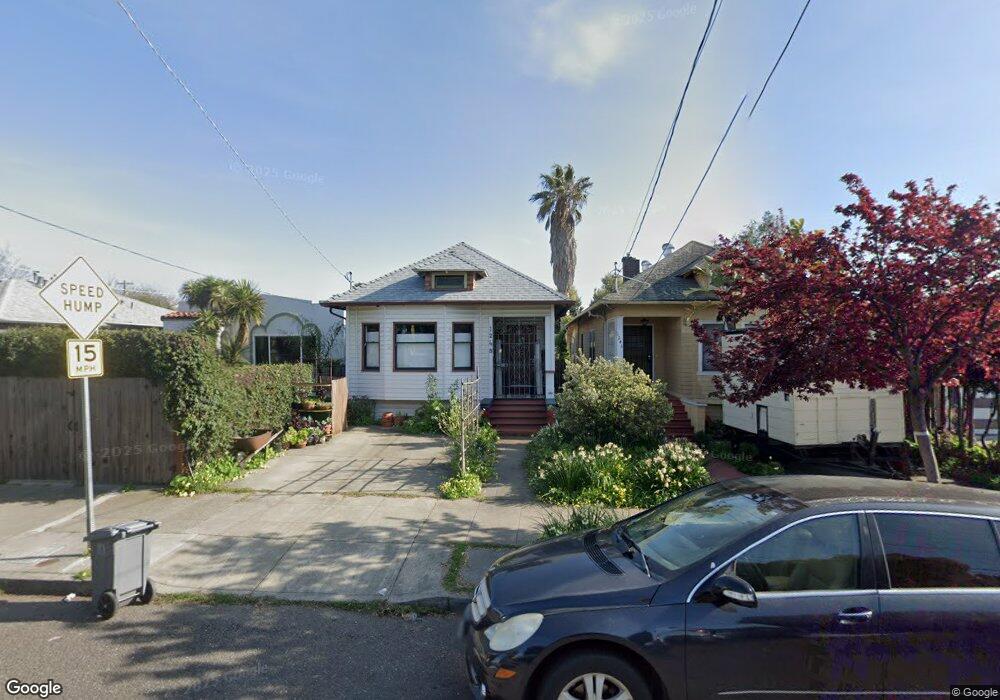
1248 Carrison St Berkeley, CA 94702
West Berkeley NeighborhoodEstimated Value: $807,000 - $951,000
3
Beds
1
Bath
943
Sq Ft
$920/Sq Ft
Est. Value
About This Home
This home is located at 1248 Carrison St, Berkeley, CA 94702 and is currently estimated at $867,766, approximately $920 per square foot. 1248 Carrison St is a home located in Alameda County with nearby schools including Malcolm X Elementary School, Oxford Elementary School, and Washington Elementary School.
Ownership History
Date
Name
Owned For
Owner Type
Purchase Details
Closed on
Jun 1, 1998
Sold by
Peals Ora Lee
Bought by
Bretz Alan L and Jones Helen
Current Estimated Value
Home Financials for this Owner
Home Financials are based on the most recent Mortgage that was taken out on this home.
Original Mortgage
$88,000
Outstanding Balance
$17,681
Interest Rate
7.1%
Estimated Equity
$850,085
Purchase Details
Closed on
Jun 14, 1996
Sold by
Peals Ora Lee and Tinker Warren D
Bought by
Peals Ora Lee
Create a Home Valuation Report for This Property
The Home Valuation Report is an in-depth analysis detailing your home's value as well as a comparison with similar homes in the area
Home Values in the Area
Average Home Value in this Area
Purchase History
| Date | Buyer | Sale Price | Title Company |
|---|---|---|---|
| Bretz Alan L | $110,000 | Nortwestern Title Company | |
| Peals Ora Lee | -- | -- |
Source: Public Records
Mortgage History
| Date | Status | Borrower | Loan Amount |
|---|---|---|---|
| Open | Bretz Alan L | $88,000 |
Source: Public Records
Tax History
| Year | Tax Paid | Tax Assessment Tax Assessment Total Assessment is a certain percentage of the fair market value that is determined by local assessors to be the total taxable value of land and additions on the property. | Land | Improvement |
|---|---|---|---|---|
| 2025 | $4,432 | $168,633 | $52,690 | $122,943 |
| 2024 | $4,432 | $165,190 | $51,657 | $120,533 |
| 2023 | $4,261 | $168,814 | $50,644 | $118,170 |
| 2022 | $4,087 | $158,504 | $49,651 | $115,853 |
| 2021 | $4,071 | $155,258 | $48,677 | $113,581 |
| 2020 | $3,809 | $160,596 | $48,179 | $112,417 |
| 2019 | $3,601 | $157,447 | $47,234 | $110,213 |
| 2018 | $3,514 | $154,361 | $46,308 | $108,053 |
| 2017 | $3,357 | $151,335 | $45,400 | $105,935 |
| 2016 | $3,195 | $148,368 | $44,510 | $103,858 |
| 2015 | $3,233 | $146,140 | $43,842 | $102,298 |
| 2014 | $2,995 | $143,277 | $42,983 | $100,294 |
Source: Public Records
Map
Nearby Homes
- 3032 Mabel St
- 1080 67th St
- 1314 Ashby Ave
- 1237 Ashby Ave
- 6628 Helen Ct
- 6500 San Pablo Ave
- 6501 San Pablo Ave Unit 410
- 6465 San Pablo Ave Unit 203
- 1126 Ocean Ave
- 1507 Prince St
- 3101 Sacramento St
- 2751 Wallace St
- 1164 Ocean Ave
- 2747 San Pablo Ave Unit 507
- 1200 65th St Unit 224
- 1156 64th St
- 3224 Sacramento St
- 1034 Grayson St
- 3110 California St
- 3114 California St
- 1246 Carrison St
- 1250 Carrison St
- 1244 Carrison St
- 1256 Carrison St
- 1240 Carrison St
- 1258 Carrison St
- 1226 Carrison St
- 1249 Haskell St
- 1243 Haskell St
- 1253 Haskell St
- 1239 Haskell St
- 3028 Mabel St
- 3038 Mabel St
- 3024 Mabel St
- 1237 Haskell St
- 1214 Carrison St
- 1216 Carrison St
- 3040 Mabel St
- 1235 Haskell St
- 1251 Carrison St
Your Personal Tour Guide
Ask me questions while you tour the home.