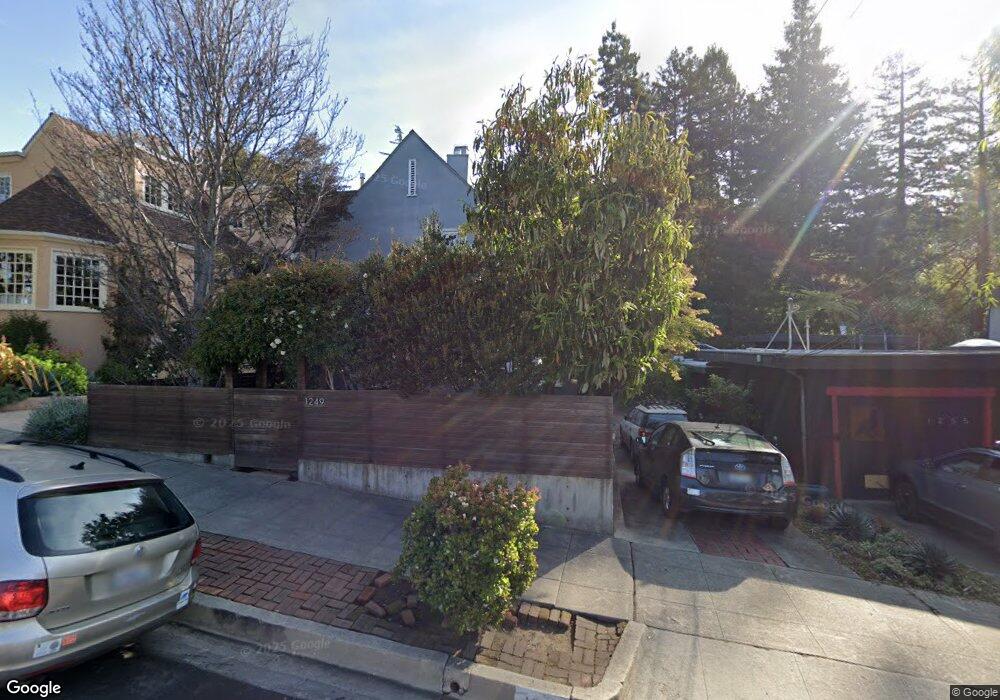
1249 Spruce St Berkeley, CA 94709
Berkeley Hills NeighborhoodEstimated Value: $1,533,378 - $1,710,000
3
Beds
3
Baths
1,649
Sq Ft
$988/Sq Ft
Est. Value
About This Home
This home is located at 1249 Spruce St, Berkeley, CA 94709 and is currently estimated at $1,628,595, approximately $987 per square foot. 1249 Spruce St is a home located in Alameda County with nearby schools including Cragmont Elementary School, Berkeley Arts Magnet at Whittier School, and Washington Elementary School.
Ownership History
Date
Name
Owned For
Owner Type
Purchase Details
Closed on
Mar 10, 2018
Sold by
Chen Jeff Tai Li and Protas Meredith
Bought by
Chen Jeff and Protas Meredith
Current Estimated Value
Purchase Details
Closed on
Jan 18, 2017
Sold by
Chen Jeff T
Bought by
Chen Jeff Tai Li and Protas Meredith
Purchase Details
Closed on
Oct 7, 2010
Sold by
Protas Meredith E
Bought by
Chen Jeff T
Home Financials for this Owner
Home Financials are based on the most recent Mortgage that was taken out on this home.
Original Mortgage
$543,500
Outstanding Balance
$357,006
Interest Rate
4.26%
Mortgage Type
New Conventional
Estimated Equity
$1,271,589
Purchase Details
Closed on
Sep 19, 2006
Sold by
Laib Caroline and Estate Of Karoline Dorothea La
Bought by
Chen Jeff T
Home Financials for this Owner
Home Financials are based on the most recent Mortgage that was taken out on this home.
Original Mortgage
$587,300
Interest Rate
6.53%
Mortgage Type
Purchase Money Mortgage
Create a Home Valuation Report for This Property
The Home Valuation Report is an in-depth analysis detailing your home's value as well as a comparison with similar homes in the area
Home Values in the Area
Average Home Value in this Area
Purchase History
| Date | Buyer | Sale Price | Title Company |
|---|---|---|---|
| Chen Jeff | -- | None Available | |
| Chen Jeff Tai Li | -- | None Available | |
| Chen Jeff T | -- | Placer Title Company | |
| Chen Jeff T | $839,000 | Placer Title Company |
Source: Public Records
Mortgage History
| Date | Status | Borrower | Loan Amount |
|---|---|---|---|
| Open | Chen Jeff T | $543,500 | |
| Closed | Chen Jeff T | $587,300 |
Source: Public Records
Tax History
| Year | Tax Paid | Tax Assessment Tax Assessment Total Assessment is a certain percentage of the fair market value that is determined by local assessors to be the total taxable value of land and additions on the property. | Land | Improvement |
|---|---|---|---|---|
| 2025 | $16,452 | $1,117,862 | $337,197 | $780,665 |
| 2024 | $16,452 | $1,095,949 | $330,587 | $765,362 |
| 2023 | $16,120 | $1,074,463 | $324,106 | $750,357 |
| 2022 | $15,850 | $1,053,402 | $317,753 | $735,649 |
| 2021 | $15,900 | $1,032,751 | $311,524 | $721,227 |
| 2020 | $15,083 | $1,022,161 | $308,329 | $713,832 |
| 2019 | $14,532 | $1,002,127 | $302,286 | $699,841 |
| 2018 | $14,301 | $982,484 | $296,361 | $686,123 |
| 2017 | $13,812 | $963,226 | $290,552 | $672,674 |
| 2016 | $13,401 | $944,343 | $284,856 | $659,487 |
| 2015 | $13,229 | $930,166 | $280,580 | $649,586 |
| 2014 | $13,211 | $916,951 | $275,085 | $641,866 |
Source: Public Records
Map
Nearby Homes
- 2315 Eunice St
- 2121 Eunice St
- 2501 Rose Walk
- 1444 Walnut St
- 1515 Oxford St Unit 1D
- 1408 Henry St
- 1950 Hopkins St
- 1004 Cragmont Ave
- 1622 Scenic Ave
- 2686 Shasta Rd
- 2421 Hilgard Ave
- 1106 Cragmont Ave
- 1425 Martin Luther King jr Way
- 1682 Oxford St
- 2201 Virginia St Unit 2
- 2477 Virginia St
- 2340 Virginia St
- 1165 Cragmont Ave
- 962 Regal Rd
- 2600 Hilgard Ave
Your Personal Tour Guide
Ask me questions while you tour the home.