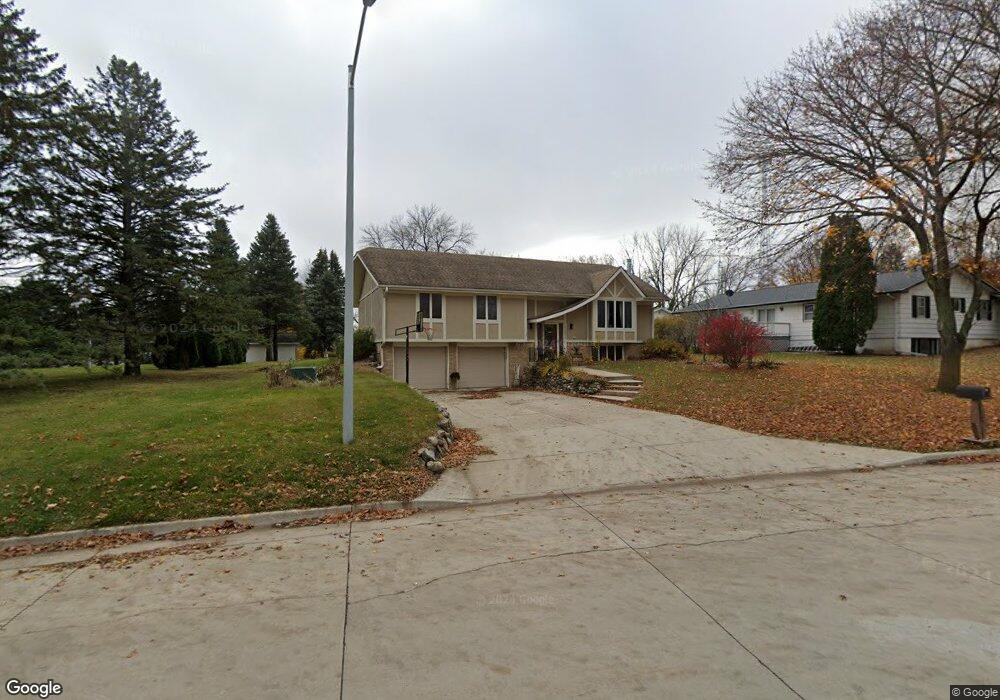
125 5th St Lake View, IA 51450
Estimated Value: $218,000 - $240,282
--
Bed
1
Bath
1,626
Sq Ft
$142/Sq Ft
Est. Value
About This Home
This home is located at 125 5th St, Lake View, IA 51450 and is currently estimated at $230,571, approximately $141 per square foot. 125 5th St is a home located in Sac County with nearby schools including East Sac County High School.
Ownership History
Date
Name
Owned For
Owner Type
Purchase Details
Closed on
Mar 4, 2011
Sold by
Fanning Jillian
Bought by
Gordon Judy
Current Estimated Value
Purchase Details
Closed on
Jan 22, 2010
Sold by
Hall Marilyn K
Bought by
Fanning Jillian
Home Financials for this Owner
Home Financials are based on the most recent Mortgage that was taken out on this home.
Original Mortgage
$76,800
Interest Rate
5%
Mortgage Type
Purchase Money Mortgage
Create a Home Valuation Report for This Property
The Home Valuation Report is an in-depth analysis detailing your home's value as well as a comparison with similar homes in the area
Home Values in the Area
Average Home Value in this Area
Purchase History
| Date | Buyer | Sale Price | Title Company |
|---|---|---|---|
| Gordon Judy | $100,000 | None Available | |
| Fanning Jillian | $96,000 | None Available |
Source: Public Records
Mortgage History
| Date | Status | Borrower | Loan Amount |
|---|---|---|---|
| Previous Owner | Fanning Jillian | $76,800 |
Source: Public Records
Tax History Compared to Growth
Tax History
| Year | Tax Paid | Tax Assessment Tax Assessment Total Assessment is a certain percentage of the fair market value that is determined by local assessors to be the total taxable value of land and additions on the property. | Land | Improvement |
|---|---|---|---|---|
| 2025 | $3,038 | $262,960 | $4,610 | $258,350 |
| 2024 | $3,038 | $223,830 | $4,310 | $219,520 |
| 2023 | $2,434 | $223,830 | $4,310 | $219,520 |
| 2022 | $2,358 | $164,510 | $4,310 | $160,200 |
| 2021 | $2,358 | $164,510 | $4,310 | $160,200 |
| 2020 | $1,912 | $130,350 | $4,310 | $126,040 |
| 2019 | $1,696 | $130,350 | $4,310 | $126,040 |
| 2018 | $1,698 | $113,390 | $0 | $0 |
| 2017 | $1,698 | $103,470 | $0 | $0 |
| 2016 | $1,568 | $103,470 | $0 | $0 |
| 2015 | $1,568 | $100,300 | $0 | $0 |
| 2014 | $1,528 | $100,300 | $0 | $0 |
Source: Public Records
Map
Nearby Homes