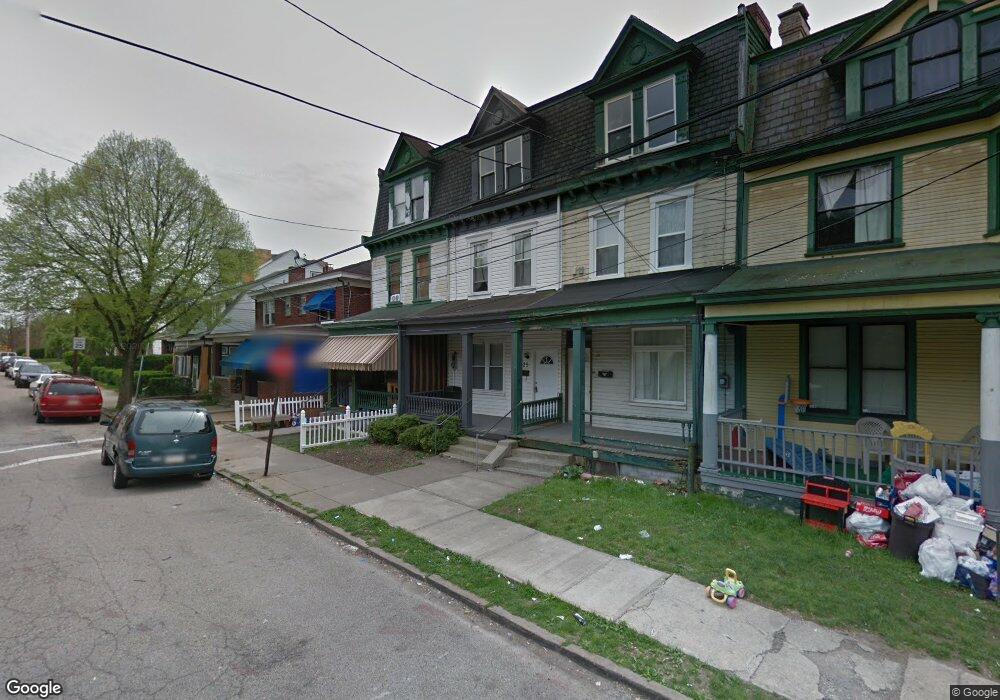
125 Bonvue St Pittsburgh, PA 15214
Perry North NeighborhoodEstimated Value: $86,000 - $192,000
4
Beds
2
Baths
2,064
Sq Ft
$70/Sq Ft
Est. Value
About This Home
This home is located at 125 Bonvue St, Pittsburgh, PA 15214 and is currently estimated at $145,507, approximately $70 per square foot. 125 Bonvue St is a home located in Allegheny County with nearby schools including Pittsburgh Morrow K-8, Pittsburgh Perry High School, and St. Cyril of Alexandria School.
Ownership History
Date
Name
Owned For
Owner Type
Purchase Details
Closed on
Dec 21, 2016
Sold by
Paolino Jeremy
Bought by
Observatory Hill Development Corp
Current Estimated Value
Home Financials for this Owner
Home Financials are based on the most recent Mortgage that was taken out on this home.
Original Mortgage
$95,000
Outstanding Balance
$76,829
Interest Rate
3.57%
Mortgage Type
Unknown
Estimated Equity
$68,678
Purchase Details
Closed on
Mar 31, 2016
Sold by
Caputo Russell J
Bought by
Paolino Jeremy
Purchase Details
Closed on
Aug 14, 2002
Sold by
Washington Mutual Bank Fa
Bought by
Caputo Russell J
Purchase Details
Closed on
Sep 24, 2001
Sold by
Kuchta Marian T
Bought by
Washington Mutual Bank Fa
Purchase Details
Closed on
Nov 12, 1998
Sold by
Myers Merick P and Myers Heather A
Bought by
Kuchta Marian
Purchase Details
Closed on
Apr 15, 1994
Sold by
Pitschke Richard A and Pitschke Patricia E
Bought by
Myers Merick P and Myers Heather A
Purchase Details
Closed on
Jan 1, 1900
Create a Home Valuation Report for This Property
The Home Valuation Report is an in-depth analysis detailing your home's value as well as a comparison with similar homes in the area
Home Values in the Area
Average Home Value in this Area
Purchase History
| Date | Buyer | Sale Price | Title Company |
|---|---|---|---|
| Observatory Hill Development Corp | $15,000 | Terra Settlement Services | |
| Paolino Jeremy | -- | Attorney | |
| Caputo Russell J | $25,000 | -- | |
| Washington Mutual Bank Fa | $965 | -- | |
| Kuchta Marian | $66,000 | -- | |
| Myers Merick P | $26,000 | -- | |
| -- | -- | -- |
Source: Public Records
Mortgage History
| Date | Status | Borrower | Loan Amount |
|---|---|---|---|
| Open | Observatory Hill Development Corp | $95,000 |
Source: Public Records
Tax History Compared to Growth
Tax History
| Year | Tax Paid | Tax Assessment Tax Assessment Total Assessment is a certain percentage of the fair market value that is determined by local assessors to be the total taxable value of land and additions on the property. | Land | Improvement |
|---|---|---|---|---|
| 2025 | $198 | $8,600 | $3,900 | $4,700 |
| 2024 | $198 | $8,600 | $3,900 | $4,700 |
| 2023 | $198 | $8,600 | $3,900 | $4,700 |
| 2022 | $196 | $8,600 | $3,900 | $4,700 |
| 2021 | $198 | $8,600 | $3,900 | $4,700 |
| 2020 | $197 | $8,700 | $4,000 | $4,700 |
| 2019 | $1,132 | $8,700 | $4,000 | $4,700 |
| 2018 | $908 | $50,000 | $10,100 | $39,900 |
| 2017 | $1,132 | $50,000 | $10,100 | $39,900 |
| 2016 | $237 | $50,000 | $10,100 | $39,900 |
| 2015 | $237 | $50,000 | $10,100 | $39,900 |
| 2014 | $1,107 | $50,000 | $10,100 | $39,900 |
Source: Public Records
Map
Nearby Homes
- 3830 Baytree St
- 221 Bonvue St
- 3840 Baytree St
- 226 Bonvue St
- 3830 East St
- 3884 East St
- 67 Semicir St
- 4033 Perrysville Ave
- 4030 Perrysville Ave
- 4007 Portman Ave
- 125 Venture St
- 3921 Portman Ave
- 3608 Perrysville Ave
- 241 Watson Blvd
- 56 Bascom Ave
- 3875 Harpen Rd
- 611 Montview St
- 4224 Evergreen Rd
- 3409 Delaware St
- 3340 Portola Ave