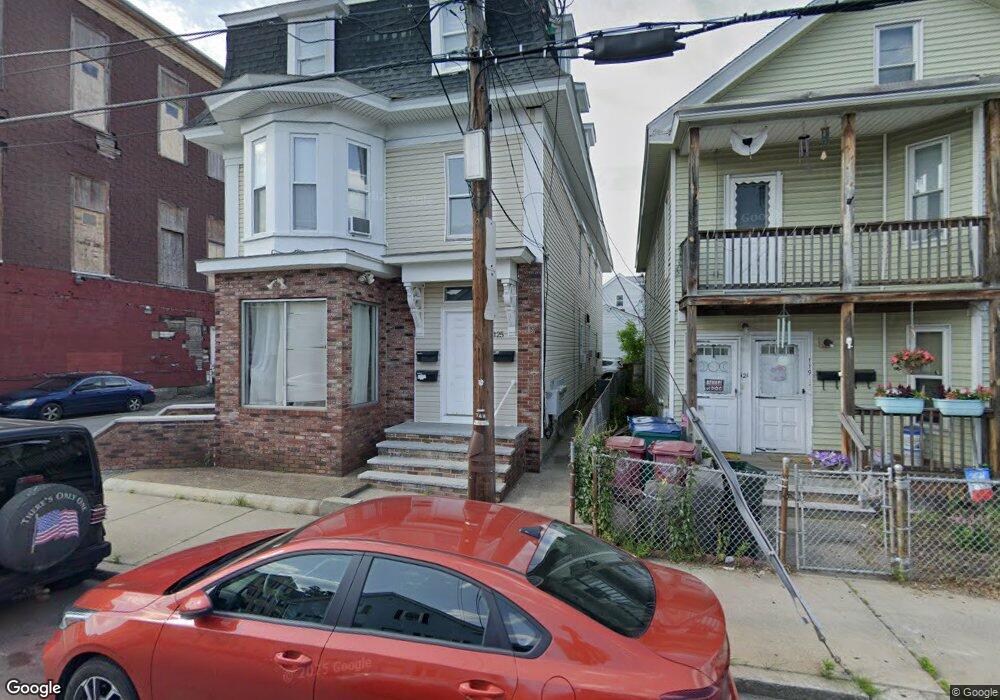
125 Branch St Lowell, MA 01851
Lower Highlands NeighborhoodEstimated Value: $746,000 - $856,000
8
Beds
3
Baths
3,389
Sq Ft
$232/Sq Ft
Est. Value
About This Home
This home is located at 125 Branch St, Lowell, MA 01851 and is currently estimated at $785,107, approximately $231 per square foot. 125 Branch St is a home located in Middlesex County with nearby schools including Charles W. Morey Elementary School, Abraham Lincoln Elementary School, and Charlotte M. Murkland Elementary School.
Ownership History
Date
Name
Owned For
Owner Type
Purchase Details
Closed on
Mar 27, 2007
Sold by
Borba Samuel F
Bought by
Simoes Janeusa Darocha
Current Estimated Value
Home Financials for this Owner
Home Financials are based on the most recent Mortgage that was taken out on this home.
Original Mortgage
$355,990
Outstanding Balance
$215,231
Interest Rate
6.33%
Mortgage Type
Commercial
Estimated Equity
$569,876
Purchase Details
Closed on
Jun 28, 2002
Sold by
Inner City Dev Llc
Bought by
Borba Samuel F
Home Financials for this Owner
Home Financials are based on the most recent Mortgage that was taken out on this home.
Original Mortgage
$245,883
Interest Rate
6.92%
Mortgage Type
Commercial
Purchase Details
Closed on
Jul 21, 2000
Sold by
Meneses Desidero and Meneses Maria N
Bought by
Inner City Dev Llc
Purchase Details
Closed on
Oct 17, 1997
Sold by
Papadopoulos Alex S
Bought by
Meneses Desidero and Meneses Flavio
Create a Home Valuation Report for This Property
The Home Valuation Report is an in-depth analysis detailing your home's value as well as a comparison with similar homes in the area
Home Values in the Area
Average Home Value in this Area
Purchase History
| Date | Buyer | Sale Price | Title Company |
|---|---|---|---|
| Simoes Janeusa Darocha | $367,000 | -- | |
| Simoes Janeusa Darocha | $367,000 | -- | |
| Borba Samuel F | $255,000 | -- | |
| Borba Samuel F | $255,000 | -- | |
| Inner City Dev Llc | $150,000 | -- | |
| Inner City Dev Llc | $150,000 | -- | |
| Meneses Desidero | $40,000 | -- | |
| Meneses Desidero | $40,000 | -- |
Source: Public Records
Mortgage History
| Date | Status | Borrower | Loan Amount |
|---|---|---|---|
| Open | Simoes Janeusa Darocha | $355,990 | |
| Closed | Meneses Desidero | $355,990 | |
| Previous Owner | Meneses Desidero | $245,883 |
Source: Public Records
Tax History Compared to Growth
Tax History
| Year | Tax Paid | Tax Assessment Tax Assessment Total Assessment is a certain percentage of the fair market value that is determined by local assessors to be the total taxable value of land and additions on the property. | Land | Improvement |
|---|---|---|---|---|
| 2025 | $7,949 | $692,400 | $127,600 | $564,800 |
| 2024 | $7,583 | $636,700 | $119,200 | $517,500 |
| 2023 | $7,433 | $598,500 | $103,700 | $494,800 |
| 2022 | $6,901 | $543,800 | $94,300 | $449,500 |
| 2021 | $5,967 | $443,300 | $82,000 | $361,300 |
| 2020 | $5,486 | $410,600 | $82,000 | $328,600 |
| 2019 | $5,325 | $379,300 | $75,900 | $303,400 |
| 2018 | $4,862 | $337,900 | $72,300 | $265,600 |
| 2017 | $4,604 | $308,600 | $65,700 | $242,900 |
| 2016 | -- | $274,300 | $77,500 | $196,800 |
| 2015 | $5,388 | $274,300 | $77,500 | $196,800 |
| 2013 | $5,388 | $248,500 | $86,100 | $162,400 |
Source: Public Records
Map
Nearby Homes
- 121 Branch St
- 129 Branch St
- 117 Branch St Unit B
- 117 Branch St
- 13 Smith Ave
- 115 Branch St Unit A
- 115 Branch St
- 135 Branch St
- 14 Smith Ave
- 126 Branch St
- 16 Smith Ave
- 122 Branch St
- 132 Branch St
- 110 Branch St Unit 11
- 110 Branch St Unit 10
- 110 Branch St Unit 9
- 110 Branch St Unit 8
- 110 Branch St Unit 5
- 110 Branch St Unit 3
- 110 Branch St Unit 2