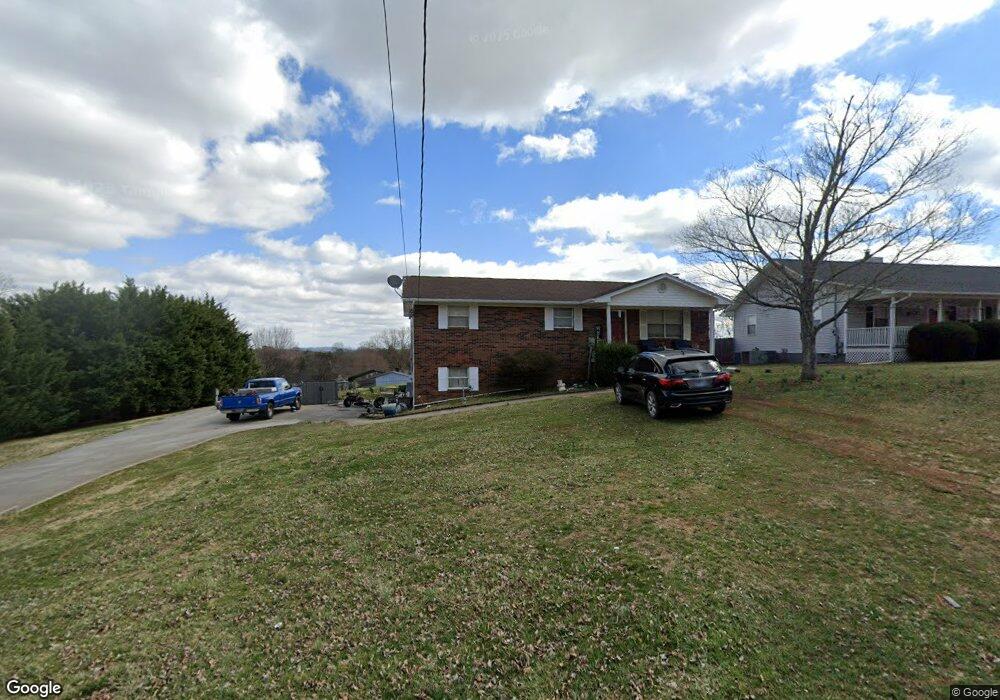
125 Clinch View Dr Corryton, TN 37721
Plainview NeighborhoodEstimated Value: $242,205 - $318,000
3
Beds
2
Baths
1,200
Sq Ft
$236/Sq Ft
Est. Value
About This Home
This home is located at 125 Clinch View Dr, Corryton, TN 37721 and is currently estimated at $283,301, approximately $236 per square foot. 125 Clinch View Dr is a home located in Union County with nearby schools including Luttrell Elementary School, Union County High School, and H Maynard Middle School.
Ownership History
Date
Name
Owned For
Owner Type
Purchase Details
Closed on
Sep 28, 2020
Sold by
Hensley Kayla R and Bruner Kayla R
Bought by
Hensley Ronald W and Hensley Kayla R
Current Estimated Value
Home Financials for this Owner
Home Financials are based on the most recent Mortgage that was taken out on this home.
Original Mortgage
$122,100
Outstanding Balance
$107,862
Interest Rate
2.9%
Mortgage Type
New Conventional
Estimated Equity
$175,439
Purchase Details
Closed on
Nov 17, 2008
Sold by
Sivyer Christopher M
Bought by
Bruner Kayla R
Purchase Details
Closed on
Jul 17, 1995
Bought by
Sivyer Christopher M %Sunbelt National Mortga
Purchase Details
Closed on
Feb 22, 1982
Bought by
Walker Joey C
Purchase Details
Closed on
Jan 1, 1982
Create a Home Valuation Report for This Property
The Home Valuation Report is an in-depth analysis detailing your home's value as well as a comparison with similar homes in the area
Home Values in the Area
Average Home Value in this Area
Purchase History
| Date | Buyer | Sale Price | Title Company |
|---|---|---|---|
| Hensley Ronald W | -- | Paramount Title Services Llc | |
| Hensley Ronald W | -- | Paramount Title Services Llc | |
| Bruner Kayla R | $105,800 | -- | |
| Bruner Kayla R | $105,800 | -- | |
| Sivyer Christopher M %Sunbelt National Mortga | $69,900 | -- | |
| Sivyer Christopher M %Sunbelt National Mortga | $69,900 | -- | |
| Walker Joey C | -- | -- | |
| Walker Joey C | -- | -- | |
| -- | $38,000 | -- | |
| -- | $38,000 | -- |
Source: Public Records
Mortgage History
| Date | Status | Borrower | Loan Amount |
|---|---|---|---|
| Open | Hensley Ronald W | $122,100 | |
| Closed | Hensley Ronald W | $122,100 |
Source: Public Records
Tax History
| Year | Tax Paid | Tax Assessment Tax Assessment Total Assessment is a certain percentage of the fair market value that is determined by local assessors to be the total taxable value of land and additions on the property. | Land | Improvement |
|---|---|---|---|---|
| 2025 | $789 | $41,550 | $6,250 | $35,300 |
| 2024 | $789 | $41,550 | $6,250 | $35,300 |
| 2023 | $789 | $41,550 | $6,250 | $35,300 |
| 2022 | $661 | $41,550 | $6,250 | $35,300 |
| 2021 | $578 | $27,000 | $4,500 | $22,500 |
| 2020 | $578 | $27,000 | $4,500 | $22,500 |
| 2019 | $578 | $27,000 | $4,500 | $22,500 |
| 2018 | $578 | $27,000 | $4,500 | $22,500 |
| 2017 | $578 | $27,000 | $4,500 | $22,500 |
| 2016 | $561 | $25,850 | $4,575 | $21,275 |
| 2015 | $561 | $25,850 | $4,575 | $21,275 |
| 2014 | $463 | $25,849 | $0 | $0 |
Source: Public Records
Map
Nearby Homes
- 157 Acorn Dr
- 408 E Mountain View Rd
- 265 Pecan Cir
- 411 Meadowbreeze Rd
- 130 Gentry Ln
- 295 Clear Branch Rd
- 328 2nd St
- 540 Monday Rd
- 233 Tennessee 370
- 417 Wolfe Rd
- 7527 Game Bird St
- 8408 Graceland Rd
- 8416 Graceland Rd
- 8.30 acres Wolfenbarger Ln
- 409 Bull Run Rd
- 00 Old Tazewell Pike
- 204 Archer Rd
- 110 Wenger Park Ln
- 9326 Davis Dr
- 0 Tazewell Pike Unit 1312170
- 121 Clinch View Dr
- 129 Clinch View Dr
- 124 Scenic View Dr
- 118 Scenic View Dr
- Lot 67 Clinch View Dr
- 128 Clinch View Dr
- 130 Scenic View Dr
- 137 Clinch View Dr
- 115 Clinch View Dr
- 116 Scenic View Dr
- 120 Clinch View Dr
- 134 Clinch View Dr
- 65 Clinch View Dr
- 113 Clinch View Dr
- 141 Clinch View Dr
- 118 Clinch View Dr
- 138 Clinch View Dr
- 127 Alpine Dr
- 133 Alpine Dr
- 121 Alpine Dr
Your Personal Tour Guide
Ask me questions while you tour the home.