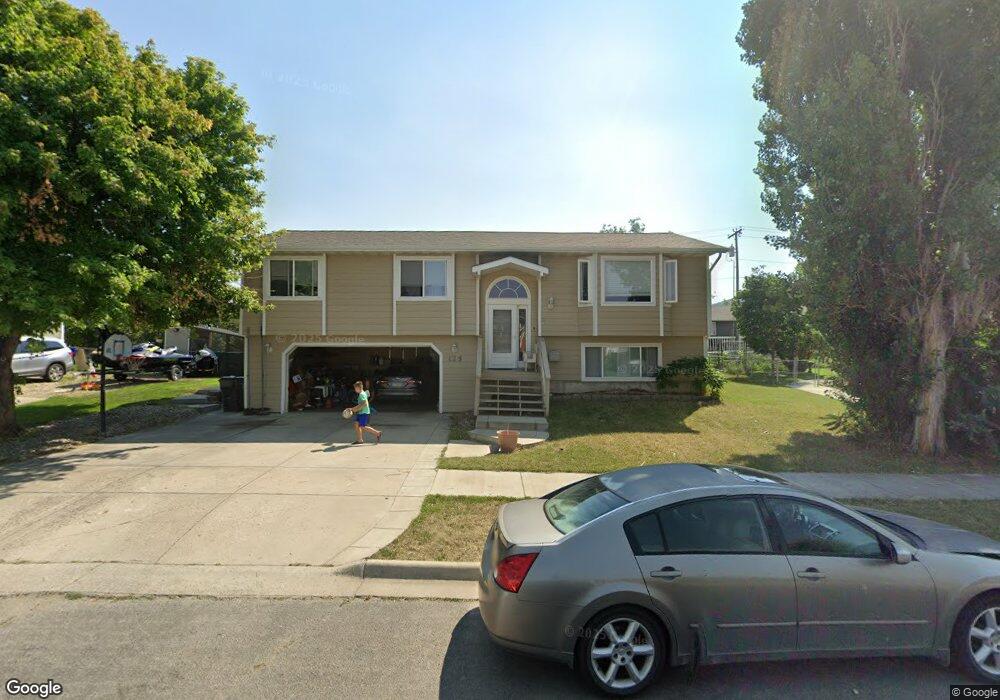
125 Colter Loop Dr Helena, MT 59602
North West NeighborhoodEstimated Value: $449,038 - $470,000
4
Beds
3
Baths
1,862
Sq Ft
$248/Sq Ft
Est. Value
About This Home
This home is located at 125 Colter Loop Dr, Helena, MT 59602 and is currently estimated at $462,010, approximately $248 per square foot. 125 Colter Loop Dr is a home located in Lewis and Clark County with nearby schools including Four Georgians Elementary School, C.R. Anderson Middle School, and Helena Christian Academy.
Ownership History
Date
Name
Owned For
Owner Type
Purchase Details
Closed on
Jul 16, 2018
Sold by
King Theresa M and King Michael W
Bought by
Singh Tanner
Current Estimated Value
Home Financials for this Owner
Home Financials are based on the most recent Mortgage that was taken out on this home.
Original Mortgage
$250,267
Outstanding Balance
$216,894
Interest Rate
4.5%
Mortgage Type
VA
Estimated Equity
$245,116
Purchase Details
Closed on
Aug 26, 2008
Sold by
Burgess Thomas M
Bought by
King Theresa M and King Michael W
Home Financials for this Owner
Home Financials are based on the most recent Mortgage that was taken out on this home.
Original Mortgage
$220,039
Interest Rate
6.5%
Mortgage Type
FHA
Purchase Details
Closed on
Oct 13, 2006
Sold by
Ebelt Jon R and Ebelt Letha
Bought by
Burgess Thomas M
Home Financials for this Owner
Home Financials are based on the most recent Mortgage that was taken out on this home.
Original Mortgage
$156,000
Interest Rate
6.39%
Mortgage Type
New Conventional
Create a Home Valuation Report for This Property
The Home Valuation Report is an in-depth analysis detailing your home's value as well as a comparison with similar homes in the area
Home Values in the Area
Average Home Value in this Area
Purchase History
| Date | Buyer | Sale Price | Title Company |
|---|---|---|---|
| Singh Tanner | -- | First American Title Ins Co | |
| King Theresa M | -- | Chicago Title Insurance Comp | |
| Burgess Thomas M | -- | Ha&Tco |
Source: Public Records
Mortgage History
| Date | Status | Borrower | Loan Amount |
|---|---|---|---|
| Open | Singh Tanner | $250,267 | |
| Previous Owner | King Theresa M | $220,039 | |
| Previous Owner | Burgess Thomas M | $156,000 |
Source: Public Records
Tax History
| Year | Tax Paid | Tax Assessment Tax Assessment Total Assessment is a certain percentage of the fair market value that is determined by local assessors to be the total taxable value of land and additions on the property. | Land | Improvement |
|---|---|---|---|---|
| 2025 | $2,526 | $450,800 | $0 | $0 |
| 2024 | $3,659 | $380,100 | $0 | $0 |
| 2023 | $4,139 | $380,100 | $0 | $0 |
| 2022 | $3,367 | $256,900 | $0 | $0 |
| 2021 | $2,862 | $256,900 | $0 | $0 |
| 2020 | $3,189 | $238,500 | $0 | $0 |
| 2019 | $3,192 | $238,500 | $0 | $0 |
| 2018 | $2,753 | $204,000 | $0 | $0 |
| 2017 | $2,052 | $204,000 | $0 | $0 |
| 2016 | $2,414 | $197,400 | $0 | $0 |
| 2015 | $2,026 | $197,400 | $0 | $0 |
| 2014 | $1,904 | $102,714 | $0 | $0 |
Source: Public Records
Map
Nearby Homes
- 360 Barney St Unit C
- 340 Barney St Unit A
- 161 Wedgewood Ln
- 35 Cloverview Dr
- 59 Cloverview Dr
- 322 Andesite Ave Unit A and B
- 113 Ridgewood Ln
- 3000 Villard Ave Unit 127A
- 3000 Villard Ave Unit 43
- 855 Jade St
- 906 Hialeah St
- 2553 Mchugh Ln
- 3790 Traufer Ave
- 935 W Custer Ave
- 845 Faw Rd
- 835 Onyx Place
- 3875 Yuhas Ave
- 3855 Yuhas Ave
- 1106 Hudson St
- 1415 Hollins Ave
- 131 Colter Loop Dr
- 119 Colter Loop Dr
- 420 Barney St
- 424 Barney St
- 416 Barney St
- 124 Colter Loop Dr
- 137 Colter Loop Dr
- 106 Colter Loop Dr
- 132 Colter Loop Dr
- 428 Barney St
- 412 Barney St
- 115 Colter Loop Dr
- 138 Colter Loop Dr
- 75 Colter Loop Dr
- 143 Colter Loop Dr
- 109 Colter Loop Dr
- 91 Colter Loop Dr
- 65 Colter Loop Dr
- 408 Barney St
- 419 Barney St
Your Personal Tour Guide
Ask me questions while you tour the home.