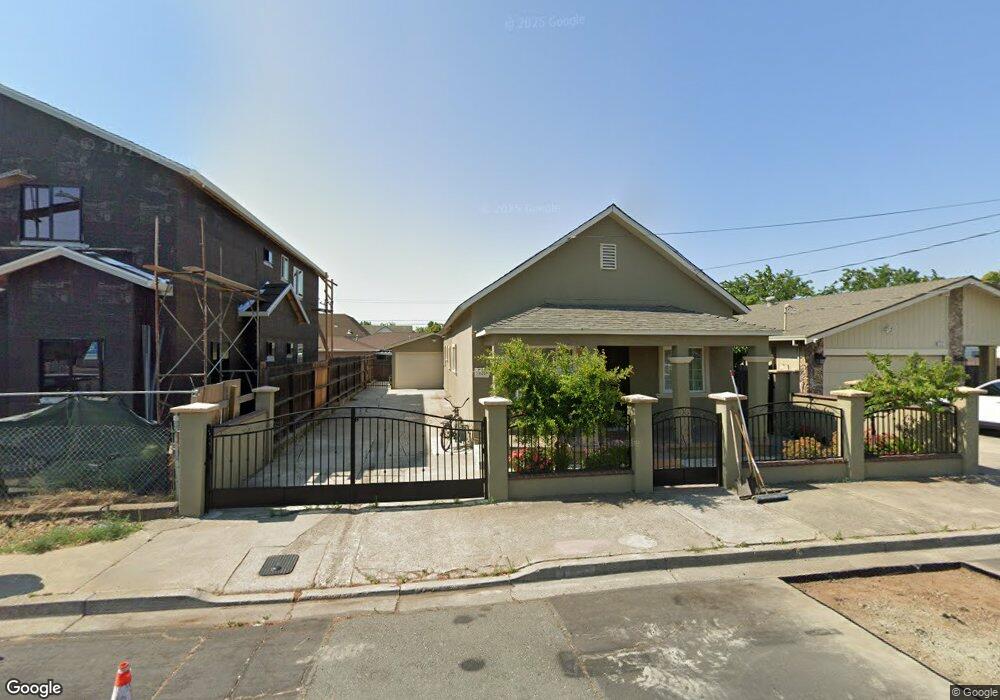
125 E Ruby St Oakley, CA 94561
Estimated Value: $490,538 - $583,000
4
Beds
2
Baths
1,443
Sq Ft
$364/Sq Ft
Est. Value
About This Home
This home is located at 125 E Ruby St, Oakley, CA 94561 and is currently estimated at $525,135, approximately $363 per square foot. 125 E Ruby St is a home located in Contra Costa County with nearby schools including Oakley Elementary School, O'Hara Park Middle School, and Freedom High School.
Ownership History
Date
Name
Owned For
Owner Type
Purchase Details
Closed on
Oct 20, 2021
Sold by
Guerrero Adelina
Bought by
Guerrero Adelina and Zelaya Maribel
Current Estimated Value
Purchase Details
Closed on
Oct 18, 2011
Sold by
Guerrero David and Guerrero Adelina
Bought by
Guerrero Adelina
Purchase Details
Closed on
Jan 10, 2000
Sold by
Guerrero Michelle
Bought by
Guerrero David
Home Financials for this Owner
Home Financials are based on the most recent Mortgage that was taken out on this home.
Original Mortgage
$50,050
Outstanding Balance
$15,902
Interest Rate
7.84%
Mortgage Type
Purchase Money Mortgage
Estimated Equity
$509,233
Purchase Details
Closed on
Dec 28, 1999
Sold by
Adelina Guerrero
Bought by
Guerrero Adelina and Guerrero David
Home Financials for this Owner
Home Financials are based on the most recent Mortgage that was taken out on this home.
Original Mortgage
$50,050
Outstanding Balance
$15,902
Interest Rate
7.84%
Mortgage Type
Purchase Money Mortgage
Estimated Equity
$509,233
Create a Home Valuation Report for This Property
The Home Valuation Report is an in-depth analysis detailing your home's value as well as a comparison with similar homes in the area
Home Values in the Area
Average Home Value in this Area
Purchase History
| Date | Buyer | Sale Price | Title Company |
|---|---|---|---|
| Guerrero Adelina | -- | None Available | |
| Guerrero Adelina | -- | None Available | |
| Guerrero David | -- | First American Title Guarant | |
| Guerrero Adelina | -- | First American Title Guarant |
Source: Public Records
Mortgage History
| Date | Status | Borrower | Loan Amount |
|---|---|---|---|
| Open | Guerrero David | $50,050 |
Source: Public Records
Tax History
| Year | Tax Paid | Tax Assessment Tax Assessment Total Assessment is a certain percentage of the fair market value that is determined by local assessors to be the total taxable value of land and additions on the property. | Land | Improvement |
|---|---|---|---|---|
| 2025 | $2,251 | $109,903 | $15,602 | $94,301 |
| 2024 | $2,196 | $107,749 | $15,297 | $92,452 |
| 2023 | $2,196 | $105,638 | $14,998 | $90,640 |
| 2022 | $2,185 | $103,567 | $14,704 | $88,863 |
| 2021 | $2,130 | $101,537 | $14,416 | $87,121 |
| 2019 | $1,902 | $98,528 | $13,990 | $84,538 |
| 2018 | $1,867 | $96,597 | $13,716 | $82,881 |
| 2017 | $1,856 | $94,704 | $13,448 | $81,256 |
| 2016 | $1,778 | $92,848 | $13,185 | $79,663 |
| 2015 | $1,786 | $91,454 | $12,987 | $78,467 |
| 2014 | $1,757 | $89,663 | $12,733 | $76,930 |
Source: Public Records
Map
Nearby Homes
- 201 Ohara Ave
- 1 Bradford Island Rd
- 1104 Jordan Ln
- 1109 Deerpark Rd
- 4730 Duarte Ave
- 4620 Duarte Ave
- 0 Almond Dr Unit 41106452
- 0 Main St Unit 41115212
- 1425 W Cypress Rd
- 912 Rhine Way
- 4920 Dawson Dr
- 459 Hazelnut Dr
- 330 W Cypress Rd
- 4855 Edgewood Ct
- 409 Hazelnut Dr
- 876 Diamante Way
- 215 Spindrift Ct
- 3901-B Rose Ave
- 633 Country Ln
- 210 W Cypress Rd Unit 1
Your Personal Tour Guide
Ask me questions while you tour the home.