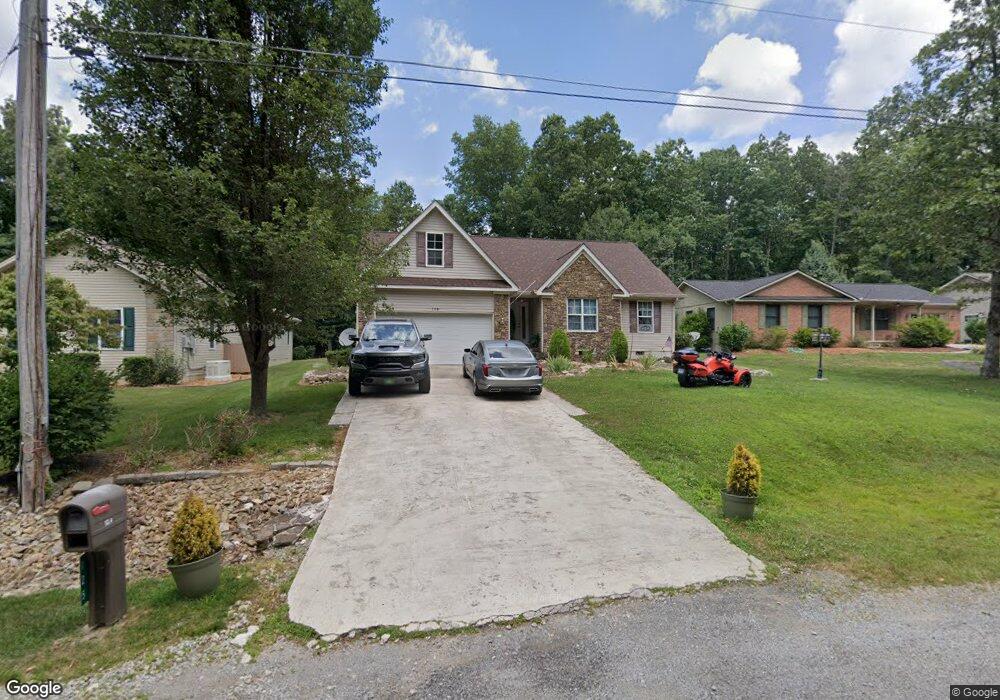
125 Ivy Ln Crossville, TN 38558
Estimated Value: $269,793 - $288,000
--
Bed
2
Baths
1,326
Sq Ft
$212/Sq Ft
Est. Value
About This Home
This home is located at 125 Ivy Ln, Crossville, TN 38558 and is currently estimated at $281,448, approximately $212 per square foot. 125 Ivy Ln is a home located in Cumberland County with nearby schools including Crab Orchard Elementary School and Stone Memorial High School.
Ownership History
Date
Name
Owned For
Owner Type
Purchase Details
Closed on
Mar 1, 2022
Sold by
Matlock Constance G
Bought by
Daniels Constance G Matlock and Daniels Jackie W
Current Estimated Value
Home Financials for this Owner
Home Financials are based on the most recent Mortgage that was taken out on this home.
Original Mortgage
$397,500
Outstanding Balance
$394,527
Interest Rate
3.92%
Mortgage Type
Credit Line Revolving
Estimated Equity
-$113,079
Purchase Details
Closed on
Dec 3, 2009
Sold by
Matlock Barbara J
Bought by
Matlock Constance G
Purchase Details
Closed on
May 15, 2006
Sold by
Offutt David
Bought by
Matlock Barbara J
Purchase Details
Closed on
Mar 22, 2005
Sold by
Fairfield Glade Community
Bought by
Offutt David A
Purchase Details
Closed on
Sep 10, 2001
Sold by
Moore John L and Moore Shirley Ann
Bought by
Finally Communities Inc
Create a Home Valuation Report for This Property
The Home Valuation Report is an in-depth analysis detailing your home's value as well as a comparison with similar homes in the area
Home Values in the Area
Average Home Value in this Area
Purchase History
| Date | Buyer | Sale Price | Title Company |
|---|---|---|---|
| Daniels Constance G Matlock | -- | Rosenberg Lpa Llc | |
| Matlock Constance G | -- | -- | |
| Matlock Barbara J | $152,500 | -- | |
| Offutt David A | $2,200 | -- | |
| Finally Communities Inc | -- | -- |
Source: Public Records
Mortgage History
| Date | Status | Borrower | Loan Amount |
|---|---|---|---|
| Open | Daniels Constance G Matlock | $397,500 | |
| Closed | Daniels Constance G Matlock | $397,500 |
Source: Public Records
Tax History Compared to Growth
Tax History
| Year | Tax Paid | Tax Assessment Tax Assessment Total Assessment is a certain percentage of the fair market value that is determined by local assessors to be the total taxable value of land and additions on the property. | Land | Improvement |
|---|---|---|---|---|
| 2024 | $663 | $58,425 | $4,000 | $54,425 |
| 2023 | $663 | $58,425 | $0 | $0 |
| 2022 | $663 | $58,425 | $4,000 | $54,425 |
| 2021 | $574 | $36,675 | $2,125 | $34,550 |
| 2020 | $574 | $36,675 | $2,125 | $34,550 |
| 2019 | $574 | $36,675 | $2,125 | $34,550 |
| 2018 | $574 | $36,675 | $2,125 | $34,550 |
| 2017 | $574 | $36,675 | $2,125 | $34,550 |
| 2016 | $543 | $35,525 | $2,125 | $33,400 |
| 2015 | $532 | $35,525 | $2,125 | $33,400 |
| 2014 | $532 | $35,521 | $0 | $0 |
Source: Public Records
Map
Nearby Homes
- 121 Juniper Dr
- 123 Hamlet Dr
- 114 Juniper Dr
- 105 Kings Ln
- 116 Jana Dr
- 104 Juniper Dr
- 115 Essex Ln
- 134 Glenwood Dr
- 22 Meadowlark Cir
- 11 Oxford Cir
- 13 Oxford Cir
- 122 Glenwood Dr
- 140 Shelley Ln
- 147 Highgate Dr
- 149 Highgate Dr
- 143 Shelley Ln
- 212 Lakeview Dr
- 113 Ashdown Ln
- 157 Ivy Brook Ln
- 104 Glenwood Dr