Estimated Value: $107,000 - $121,000
3
Beds
1
Bath
927
Sq Ft
$123/Sq Ft
Est. Value
About This Home
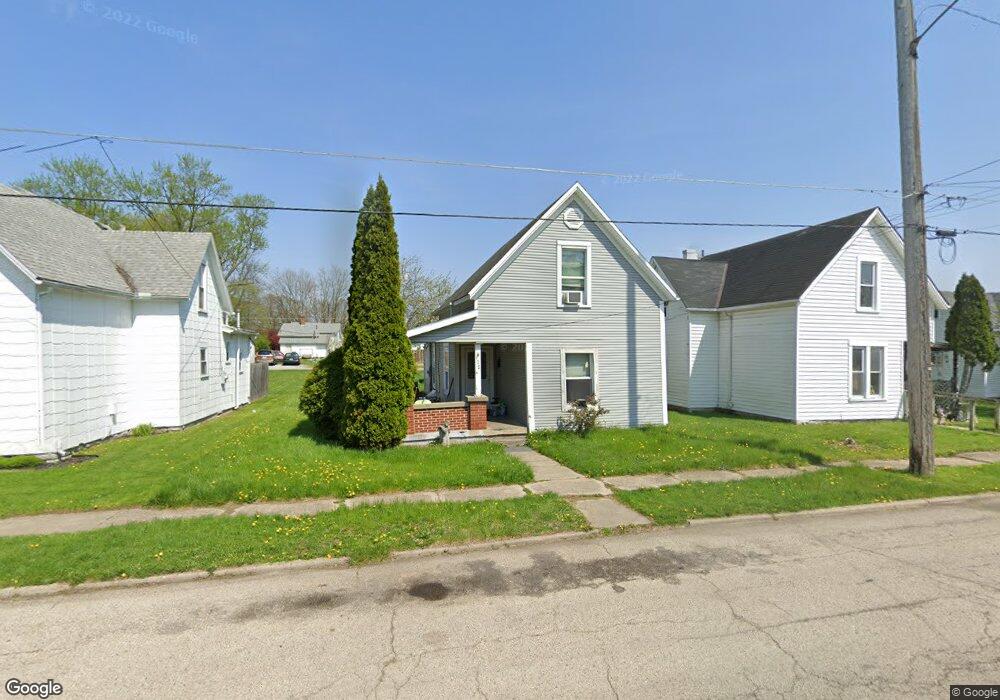
This home is located at 125 Morrow St, Piqua, OH 45356 and is currently estimated at $113,727, approximately $122 per square foot. 125 Morrow St is a home located in Miami County with nearby schools including Piqua Junior High School, Piqua High School, and Nicholas School.
Ownership History
Date
Name
Owned For
Owner Type
Purchase Details
Closed on
Mar 11, 2019
Sold by
Hall Frederick L and Hall Frederick Lee
Bought by
Komerstone Holdings Llc
Current Estimated Value
Purchase Details
Closed on
Nov 20, 2000
Sold by
Baldasare Gary A and Baldasare Judy A
Bought by
Hall Frederick L
Purchase Details
Closed on
Mar 15, 1995
Sold by
Cutcher Timothy C
Bought by
Cutcher Timothy C
Create a Home Valuation Report for This Property
The Home Valuation Report is an in-depth analysis detailing your home's value as well as a comparison with similar homes in the area
Home Values in the Area
Average Home Value in this Area
Purchase History
| Date | Buyer | Sale Price | Title Company |
|---|---|---|---|
| Komerstone Holdings Llc | -- | None Available | |
| Hall Frederick L | $60,000 | -- | |
| Cutcher Timothy C | $44,200 | -- |
Source: Public Records
Mortgage History
| Date | Status | Borrower | Loan Amount |
|---|---|---|---|
| Closed | Cutcher Timothy C | -- |
Source: Public Records
Tax History Compared to Growth
Tax History
| Year | Tax Paid | Tax Assessment Tax Assessment Total Assessment is a certain percentage of the fair market value that is determined by local assessors to be the total taxable value of land and additions on the property. | Land | Improvement |
|---|---|---|---|---|
| 2024 | $1,024 | $24,290 | $6,650 | $17,640 |
| 2023 | $1,024 | $24,290 | $6,650 | $17,640 |
| 2022 | $1,042 | $24,290 | $6,650 | $17,640 |
| 2021 | $842 | $18,000 | $4,940 | $13,060 |
| 2020 | $827 | $18,000 | $4,940 | $13,060 |
| 2019 | $832 | $18,000 | $4,940 | $13,060 |
| 2018 | $720 | $14,850 | $4,940 | $9,910 |
| 2017 | $375 | $7,640 | $4,940 | $2,700 |
| 2016 | $371 | $7,640 | $4,940 | $2,700 |
| 2015 | $365 | $7,350 | $4,760 | $2,590 |
| 2014 | $365 | $7,350 | $4,760 | $2,590 |
| 2013 | $707 | $14,180 | $4,760 | $9,420 |
Source: Public Records
Map
Nearby Homes