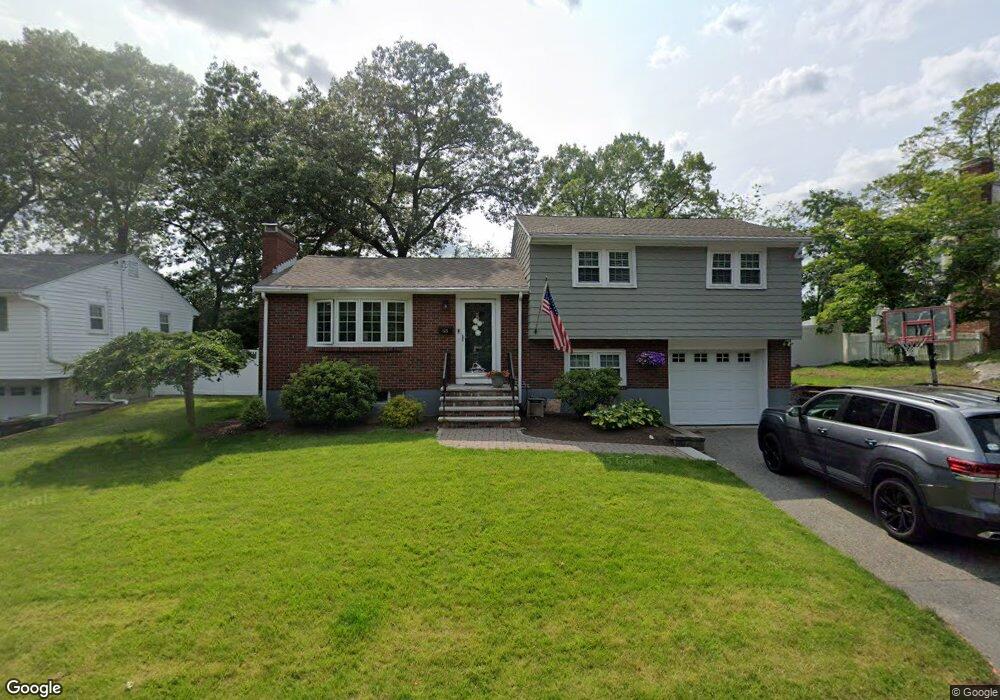
125 Pacella Dr Unit 1 Dedham, MA 02026
Dexter NeighborhoodEstimated Value: $746,000 - $949,000
3
Beds
2
Baths
1,223
Sq Ft
$673/Sq Ft
Est. Value
About This Home
This home is located at 125 Pacella Dr Unit 1, Dedham, MA 02026 and is currently estimated at $822,611, approximately $672 per square foot. 125 Pacella Dr Unit 1 is a home located in Norfolk County with nearby schools including Riverdale Elementary School, Dedham Middle School, and Dedham High School.
Ownership History
Date
Name
Owned For
Owner Type
Purchase Details
Closed on
Feb 26, 2010
Sold by
Crowley John M
Bought by
Tower Jill A and Constantine William N
Current Estimated Value
Home Financials for this Owner
Home Financials are based on the most recent Mortgage that was taken out on this home.
Original Mortgage
$373,607
Outstanding Balance
$246,254
Interest Rate
4.87%
Mortgage Type
FHA
Estimated Equity
$576,357
Create a Home Valuation Report for This Property
The Home Valuation Report is an in-depth analysis detailing your home's value as well as a comparison with similar homes in the area
Home Values in the Area
Average Home Value in this Area
Purchase History
| Date | Buyer | Sale Price | Title Company |
|---|---|---|---|
| Tower Jill A | $380,500 | -- |
Source: Public Records
Mortgage History
| Date | Status | Borrower | Loan Amount |
|---|---|---|---|
| Open | Tower Jill A | $373,607 |
Source: Public Records
Tax History
| Year | Tax Paid | Tax Assessment Tax Assessment Total Assessment is a certain percentage of the fair market value that is determined by local assessors to be the total taxable value of land and additions on the property. | Land | Improvement |
|---|---|---|---|---|
| 2025 | $9,099 | $721,000 | $366,200 | $354,800 |
| 2024 | $8,960 | $716,800 | $351,900 | $364,900 |
| 2023 | $7,942 | $618,500 | $308,800 | $309,700 |
| 2022 | $7,381 | $552,900 | $282,400 | $270,500 |
| 2021 | $7,147 | $522,800 | $287,300 | $235,500 |
| 2020 | $6,872 | $500,900 | $274,800 | $226,100 |
| 2019 | $6,962 | $492,000 | $266,500 | $225,500 |
| 2018 | $6,548 | $450,000 | $241,100 | $208,900 |
| 2017 | $6,260 | $424,100 | $213,800 | $210,300 |
| 2016 | $6,250 | $403,500 | $193,200 | $210,300 |
| 2015 | $6,135 | $386,600 | $220,000 | $166,600 |
| 2014 | $6,009 | $373,700 | $220,000 | $153,700 |
Source: Public Records
Map
Nearby Homes
- 213 Sandy Valley Rd
- 223 Robert Rd
- 8 Hillview Terrace
- 14 Eldridge Place
- 87 Horrigan Dr Unit 8
- 86 Horrigan Dr Unit 23
- 80 Horrigan Dr Unit 24
- 66 Horrigan Dr Unit 25
- 57 Horrigan Dr Unit 3
- 37 Horrigan Dr Unit 1
- 59 Grafton Ave
- 186 Carroll Ave
- 441 Washington St Unit 301
- 441 Washington St Unit 302
- 47 Village Ave Unit 203
- 44 Court St
- 1133 High
- 55 Church St Unit 1
- 6 Snow Ln
- 46 Church St
Your Personal Tour Guide
Ask me questions while you tour the home.