Estimated Value: $127,000 - $161,000
3
Beds
2
Baths
1,482
Sq Ft
$97/Sq Ft
Est. Value
About This Home
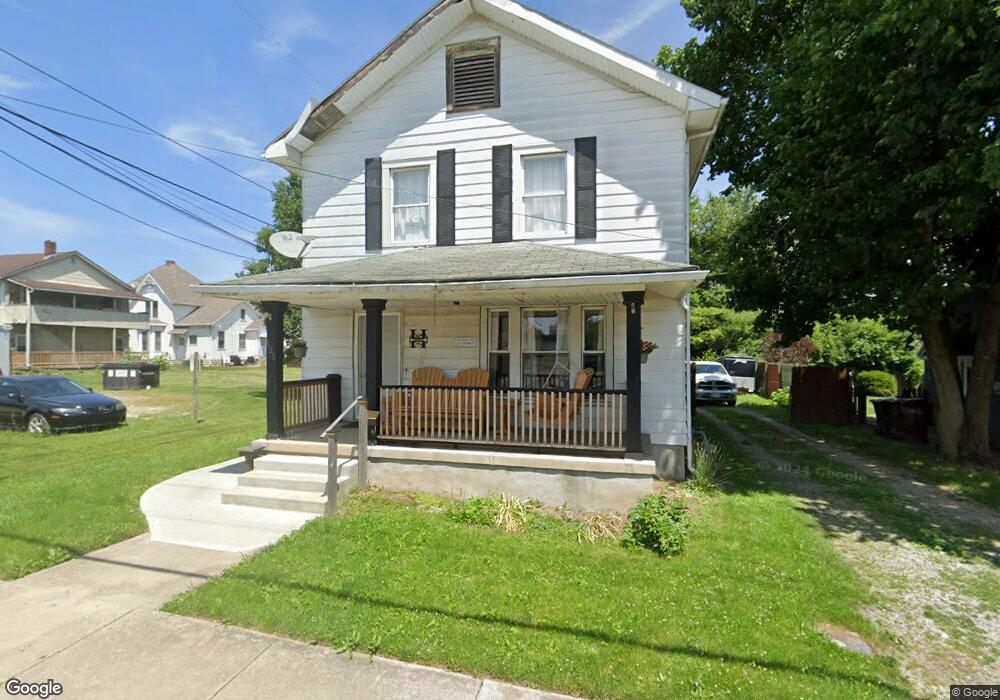
This home is located at 125 S Whiteman St, Xenia, OH 45385 and is currently estimated at $144,124, approximately $97 per square foot. 125 S Whiteman St is a home located in Greene County with nearby schools including Xenia High School, Summit Academy Community School for Alternative Learners - Xenia, and Legacy Christian Academy.
Ownership History
Date
Name
Owned For
Owner Type
Purchase Details
Closed on
Jun 21, 2021
Sold by
Crone Lawrence and Crone Kelly
Bought by
Harmon Claude Stephen
Current Estimated Value
Home Financials for this Owner
Home Financials are based on the most recent Mortgage that was taken out on this home.
Original Mortgage
$75,000
Interest Rate
2.2%
Mortgage Type
Future Advance Clause Open End Mortgage
Purchase Details
Closed on
Jan 27, 2020
Sold by
Secretary Of Housing & Urban Development
Bought by
Crone Lawrence
Purchase Details
Closed on
Sep 26, 2019
Sold by
Midfirst Bank
Bought by
Secretary Of Housing & Urban Development
Purchase Details
Closed on
Aug 6, 2019
Sold by
Morris David D
Bought by
Midfirst Bank
Purchase Details
Closed on
Nov 30, 1995
Sold by
Snyder Mary T
Bought by
Morris David D
Home Financials for this Owner
Home Financials are based on the most recent Mortgage that was taken out on this home.
Original Mortgage
$54,806
Interest Rate
7.44%
Mortgage Type
FHA
Create a Home Valuation Report for This Property
The Home Valuation Report is an in-depth analysis detailing your home's value as well as a comparison with similar homes in the area
Home Values in the Area
Average Home Value in this Area
Purchase History
| Date | Buyer | Sale Price | Title Company |
|---|---|---|---|
| Harmon Claude Stephen | $85,000 | Vantage Land Title | |
| Crone Lawrence | $16,500 | None Available | |
| Secretary Of Housing & Urban Development | -- | None Available | |
| Midfirst Bank | $42,867 | None Available | |
| Morris David D | $55,900 | -- |
Source: Public Records
Mortgage History
| Date | Status | Borrower | Loan Amount |
|---|---|---|---|
| Previous Owner | Harmon Claude Stephen | $75,000 | |
| Previous Owner | Morris David D | $54,806 |
Source: Public Records
Tax History Compared to Growth
Tax History
| Year | Tax Paid | Tax Assessment Tax Assessment Total Assessment is a certain percentage of the fair market value that is determined by local assessors to be the total taxable value of land and additions on the property. | Land | Improvement |
|---|---|---|---|---|
| 2024 | $1,494 | $35,840 | $3,030 | $32,810 |
| 2023 | $1,494 | $35,840 | $3,030 | $32,810 |
| 2022 | $1,308 | $26,750 | $2,430 | $24,320 |
| 2021 | $1,360 | $16,620 | $2,430 | $14,190 |
| 2020 | $810 | $16,620 | $2,430 | $14,190 |
| 2019 | $758 | $14,640 | $2,540 | $12,100 |
| 2018 | $760 | $14,640 | $2,540 | $12,100 |
| 2017 | $775 | $14,640 | $2,540 | $12,100 |
| 2016 | $776 | $14,650 | $2,540 | $12,110 |
| 2015 | $778 | $14,650 | $2,540 | $12,110 |
| 2014 | $745 | $14,650 | $2,540 | $12,110 |
Source: Public Records
Map
Nearby Homes
- 36 Leaman St
- 75 W 2nd St
- 98 W 3rd St
- 400 S Detroit St
- 222 Washington St
- 148 Home Ave
- 293 S Miami Ave
- 119 Park Dr
- 541 E Main St
- 607 E Main St
- 633 Xenia Ave
- 654 E 3rd St
- 612 E Market St
- 137 Pleasant St
- 645 E Church St
- 348 S Stadium Dr
- 453 Walnut St
- 479 N Stadium Dr
- 847 S Detroit St
- 305-325 Bellbrook Ave