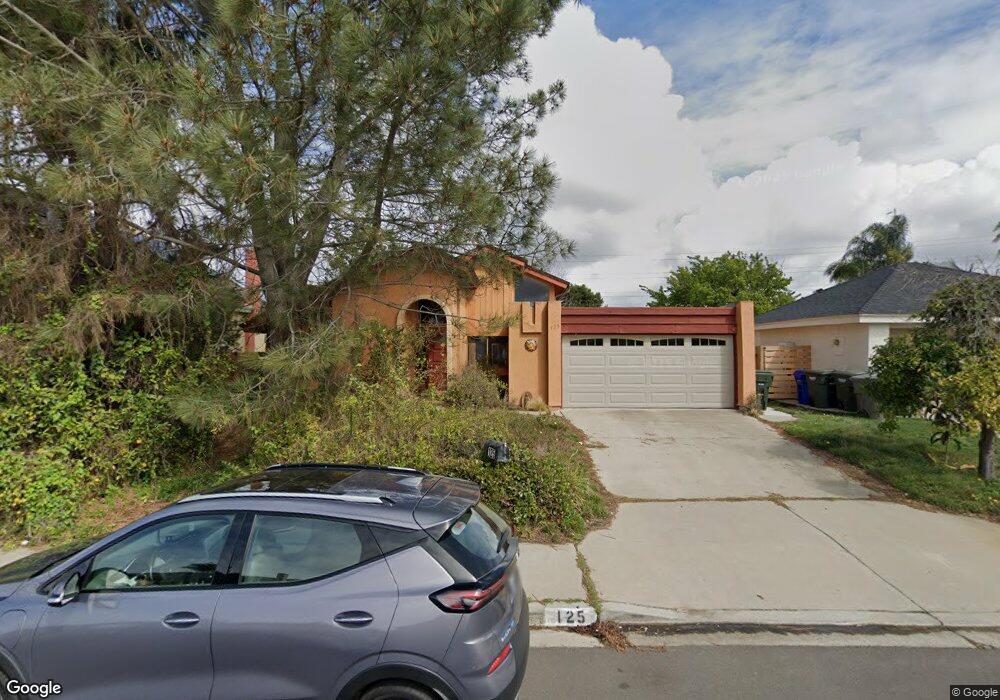
125 Solace Ct Encinitas, CA 92024
Central Encinitas NeighborhoodEstimated Value: $1,604,337 - $1,758,000
3
Beds
2
Baths
1,830
Sq Ft
$926/Sq Ft
Est. Value
About This Home
This home is located at 125 Solace Ct, Encinitas, CA 92024 and is currently estimated at $1,694,584, approximately $926 per square foot. 125 Solace Ct is a home located in San Diego County with nearby schools including Park Dale Lane Elementary, Diegueno Middle School, and La Costa Canyon High School.
Ownership History
Date
Name
Owned For
Owner Type
Purchase Details
Closed on
Jul 20, 2020
Sold by
Griest Kim
Bought by
Griest Kim Ellwood and Kim Griest Trust
Current Estimated Value
Purchase Details
Closed on
Mar 5, 2008
Sold by
Griest Kim
Bought by
Griest Kim
Home Financials for this Owner
Home Financials are based on the most recent Mortgage that was taken out on this home.
Original Mortgage
$140,000
Interest Rate
5.65%
Mortgage Type
New Conventional
Purchase Details
Closed on
Apr 23, 2003
Sold by
Vohryzek Eleanor
Bought by
Griest Kim
Home Financials for this Owner
Home Financials are based on the most recent Mortgage that was taken out on this home.
Original Mortgage
$285,000
Outstanding Balance
$120,544
Interest Rate
5.54%
Estimated Equity
$1,574,040
Purchase Details
Closed on
Dec 14, 1993
Sold by
Simpson Linda L
Bought by
Griest Kim and Vohryzek Eleanor
Home Financials for this Owner
Home Financials are based on the most recent Mortgage that was taken out on this home.
Original Mortgage
$182,700
Interest Rate
7.29%
Create a Home Valuation Report for This Property
The Home Valuation Report is an in-depth analysis detailing your home's value as well as a comparison with similar homes in the area
Home Values in the Area
Average Home Value in this Area
Purchase History
| Date | Buyer | Sale Price | Title Company |
|---|---|---|---|
| Griest Kim Ellwood | -- | None Available | |
| Griest Kim | -- | Fidelity National Title San | |
| Griest Kim | -- | Fidelity Title | |
| Griest Kim | $203,000 | Fidelity National Title |
Source: Public Records
Mortgage History
| Date | Status | Borrower | Loan Amount |
|---|---|---|---|
| Closed | Griest Kim | $140,000 | |
| Open | Griest Kim | $285,000 | |
| Closed | Griest Kim | $182,700 |
Source: Public Records
Tax History
| Year | Tax Paid | Tax Assessment Tax Assessment Total Assessment is a certain percentage of the fair market value that is determined by local assessors to be the total taxable value of land and additions on the property. | Land | Improvement |
|---|---|---|---|---|
| 2025 | $4,145 | $345,006 | $159,540 | $185,466 |
| 2024 | $4,145 | $338,242 | $156,412 | $181,830 |
| 2023 | $4,001 | $331,611 | $153,346 | $178,265 |
| 2022 | $3,888 | $325,110 | $150,340 | $174,770 |
| 2021 | $3,805 | $318,737 | $147,393 | $171,344 |
| 2020 | $3,728 | $315,470 | $145,882 | $169,588 |
| 2019 | $3,657 | $309,285 | $143,022 | $166,263 |
| 2018 | $3,603 | $303,221 | $140,218 | $163,003 |
| 2017 | $192 | $297,276 | $137,469 | $159,807 |
| 2016 | $3,441 | $291,448 | $134,774 | $156,674 |
| 2015 | $3,366 | $287,071 | $132,750 | $154,321 |
| 2014 | $3,275 | $281,449 | $130,150 | $151,299 |
Source: Public Records
Map
Nearby Homes
- 110 Turner Ave
- 1517 Shields Ave
- 1824 Eastwood Ln
- 1862 Pleasantdale Ln
- 363 Orwell Ln
- 1759 Edgefield Ln
- 1652 Clearwater Place
- 1866 Forestdale Dr
- 1971 Azure Way
- 267 Countryhaven Rd Unit 131
- 1926 Springdale Ln
- 200 202 Neptune Ave
- 772 Conestoga Ct
- 250 258 Hillcrest Dr
- 1528 Calle Narcisos
- 246 Via Tavira
- 201 Meadow Vista Way
- 2118 Valleydale Ln
- 1982 Fairlee Dr
- 245 Fairlee Ln
Your Personal Tour Guide
Ask me questions while you tour the home.