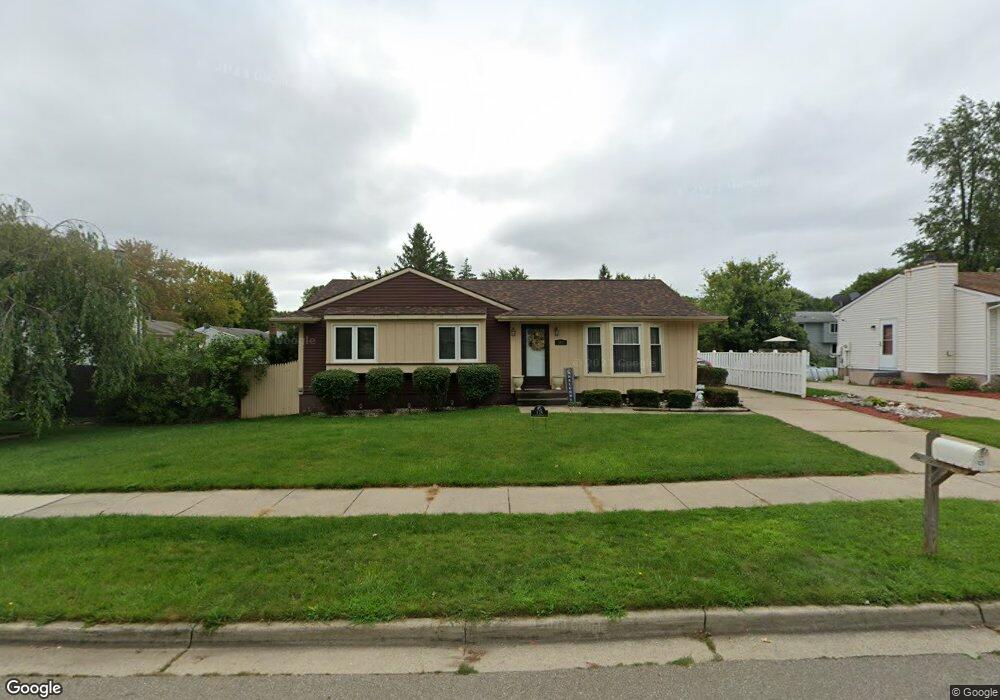
125 W Claremore Dr Lansing, MI 48911
Southern Lansing NeighborhoodEstimated Value: $174,891 - $214,000
--
Bed
--
Bath
1,056
Sq Ft
$184/Sq Ft
Est. Value
About This Home
This home is located at 125 W Claremore Dr, Lansing, MI 48911 and is currently estimated at $194,223, approximately $183 per square foot. 125 W Claremore Dr is a home located in Ingham County with nearby schools including Kendon School, Attwood School, and Everett High School.
Ownership History
Date
Name
Owned For
Owner Type
Purchase Details
Closed on
Mar 28, 2023
Sold by
Whiteside Stephanie Jones
Bought by
Whiteside Stephanie Jones
Current Estimated Value
Purchase Details
Closed on
Aug 17, 2022
Sold by
Jones Whiteside Stephanie
Bought by
Sanford Quanesa Janai
Purchase Details
Closed on
Aug 29, 2019
Sold by
Whiteside Stephanie Jones
Bought by
Whiteside Clifford Patrick
Purchase Details
Closed on
Jun 7, 2004
Sold by
Kahl Steven C and Kahl Sharie A
Bought by
Whiteside Stephanie J
Home Financials for this Owner
Home Financials are based on the most recent Mortgage that was taken out on this home.
Original Mortgage
$125,177
Interest Rate
6.17%
Mortgage Type
FHA
Purchase Details
Closed on
Jun 29, 1998
Sold by
Blow Jamie A
Bought by
Kahl Steven C and Kahl Sharie A
Purchase Details
Closed on
Aug 1, 1995
Create a Home Valuation Report for This Property
The Home Valuation Report is an in-depth analysis detailing your home's value as well as a comparison with similar homes in the area
Home Values in the Area
Average Home Value in this Area
Purchase History
| Date | Buyer | Sale Price | Title Company |
|---|---|---|---|
| Whiteside Stephanie Jones | -- | -- | |
| Sanford Quanesa Janai | -- | -- | |
| Whiteside Clifford Patrick | -- | None Available | |
| Whiteside Stephanie J | $126,500 | Trans | |
| Kahl Steven C | $91,000 | -- | |
| -- | $81,900 | -- |
Source: Public Records
Mortgage History
| Date | Status | Borrower | Loan Amount |
|---|---|---|---|
| Previous Owner | Whiteside Stephanie J | $125,177 |
Source: Public Records
Tax History Compared to Growth
Tax History
| Year | Tax Paid | Tax Assessment Tax Assessment Total Assessment is a certain percentage of the fair market value that is determined by local assessors to be the total taxable value of land and additions on the property. | Land | Improvement |
|---|---|---|---|---|
| 2025 | $3,180 | $86,800 | $13,500 | $73,300 |
| 2024 | $25 | $76,000 | $13,500 | $62,500 |
| 2023 | $2,982 | $72,000 | $13,500 | $58,500 |
| 2022 | $2,687 | $62,000 | $11,800 | $50,200 |
| 2021 | $2,632 | $58,500 | $10,500 | $48,000 |
| 2020 | $2,616 | $55,900 | $10,500 | $45,400 |
| 2019 | $2,507 | $50,600 | $10,500 | $40,100 |
| 2018 | $2,350 | $49,200 | $10,500 | $38,700 |
| 2017 | $2,249 | $49,200 | $10,500 | $38,700 |
| 2016 | $2,151 | $43,000 | $10,500 | $32,500 |
| 2015 | $2,151 | $39,500 | $20,940 | $18,560 |
| 2014 | $2,151 | $38,200 | $24,318 | $13,882 |
Source: Public Records
Map
Nearby Homes
- 218 Raritan Rd
- 6029 Ellendale Dr
- 5727 Annapolis Dr
- 5730 Laporte Dr
- 5636 Ellendale Dr
- 5902 Hilliard Rd
- 208 E Northrup St
- 129 Village Dr
- 6246 Gardenia Ave
- 6429 Rosedale Rd
- 5751 Joshua St
- 6001 Joshua St
- 6444 Sommerset Rd
- 5808 Orchard Ct
- 5750 Orchard Ct
- 6270 S Washington Ave
- 5724 Orchard Ct
- 1020 R G Curtiss Ave
- 6421 S Washington Ave
- 1014 W Northrup St
- 201 W Claremore Dr
- 119 W Claremore Dr
- 5910 Annapolis Dr
- 200 Raritan Rd
- 5920 Annapolis Dr
- 207 W Claremore Dr
- 206 Raritan Rd
- 5926 Annapolis Dr
- 118 W Claremore Dr
- 124 W Claremore Dr
- 213 W Claremore Dr
- 200 W Claremore Dr
- 6001 Chesapeake Dr
- 212 Raritan Rd
- 208 W Claremore Dr
- 5932 Annapolis Dr
- 5836 Annapolis Dr
- 219 W Claremore Dr
- 111 W Claremore Dr