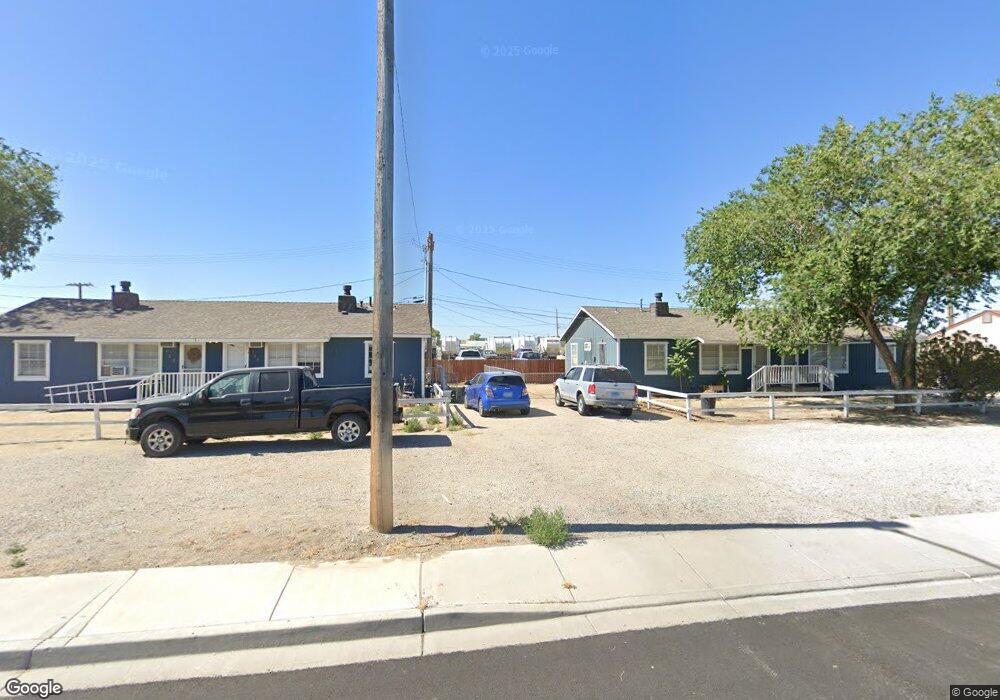
125 W D St Fallon, NV 89406
Estimated Value: $453,619 - $639,000
8
Beds
4
Baths
1,512
Sq Ft
$361/Sq Ft
Est. Value
About This Home
This home is located at 125 W D St, Fallon, NV 89406 and is currently estimated at $546,310, approximately $361 per square foot. 125 W D St is a home located in Churchill County with nearby schools including E.C. Best Elementary School, Numa Elementary School, and Lahontan Elementary School.
Ownership History
Date
Name
Owned For
Owner Type
Purchase Details
Closed on
Mar 25, 2019
Sold by
Sethi Harvinder
Bought by
Sethi Upkar
Current Estimated Value
Home Financials for this Owner
Home Financials are based on the most recent Mortgage that was taken out on this home.
Original Mortgage
$224,925
Outstanding Balance
$147,160
Interest Rate
5.5%
Mortgage Type
Adjustable Rate Mortgage/ARM
Estimated Equity
$399,150
Purchase Details
Closed on
Mar 8, 2019
Sold by
Demar Dahl Company Llc
Bought by
Sethi Gundeep and Sethi Gurpreet
Home Financials for this Owner
Home Financials are based on the most recent Mortgage that was taken out on this home.
Original Mortgage
$224,925
Outstanding Balance
$147,160
Interest Rate
5.5%
Mortgage Type
Adjustable Rate Mortgage/ARM
Estimated Equity
$399,150
Purchase Details
Closed on
Mar 28, 2018
Sold by
Ryle Veronica
Bought by
Demar Dahl Company Llc
Create a Home Valuation Report for This Property
The Home Valuation Report is an in-depth analysis detailing your home's value as well as a comparison with similar homes in the area
Home Values in the Area
Average Home Value in this Area
Purchase History
| Date | Buyer | Sale Price | Title Company |
|---|---|---|---|
| Sethi Upkar | -- | Title Svc & Escrow Fernley | |
| Sethi Gundeep | $299,900 | Title Svc & Escrow Firnley | |
| Demar Dahl Company Llc | $145,000 | None Available |
Source: Public Records
Mortgage History
| Date | Status | Borrower | Loan Amount |
|---|---|---|---|
| Open | Sethi Gundeep | $224,925 |
Source: Public Records
Tax History
| Year | Tax Paid | Tax Assessment Tax Assessment Total Assessment is a certain percentage of the fair market value that is determined by local assessors to be the total taxable value of land and additions on the property. | Land | Improvement |
|---|---|---|---|---|
| 2025 | $1,112 | $54,073 | $19,950 | $34,123 |
| 2024 | $1,404 | $54,570 | $19,950 | $34,620 |
| 2023 | $1,404 | $49,511 | $19,950 | $29,561 |
| 2022 | $1,202 | $37,229 | $11,200 | $26,029 |
| 2021 | $1,112 | $36,182 | $11,200 | $24,982 |
| 2020 | $1,016 | $35,071 | $11,200 | $23,871 |
| 2019 | $981 | $34,160 | $11,200 | $22,960 |
| 2018 | $1,296 | $33,177 | $11,200 | $21,977 |
| 2017 | $899 | $32,596 | $11,200 | $21,396 |
| 2016 | $876 | $25,515 | $11,200 | $14,315 |
| 2015 | $858 | $23,385 | $11,200 | $12,185 |
| 2014 | $831 | $21,665 | $11,200 | $10,465 |
Source: Public Records
Map
Nearby Homes
- 285 Amanda Ln
- 621 Keppel St
- 009-291-74 00929174
- 604 Keppel St
- 618 Keppel St
- 530 Michael Dr
- 119 Toiyabe Ln
- 540 Michael Dr
- 126 S Laverne St
- 800 Great Basin Ln
- 604 Serpa Place
- 00 Serpa Place
- 710 Keppel St
- 775 Karry Way
- 728 Keppel St
- 806 Karry Way
- 815 Great Basin Ln
- 250 S Taylor St
- 882 Great Basin Ln
- 345 Lincoln St
Your Personal Tour Guide
Ask me questions while you tour the home.