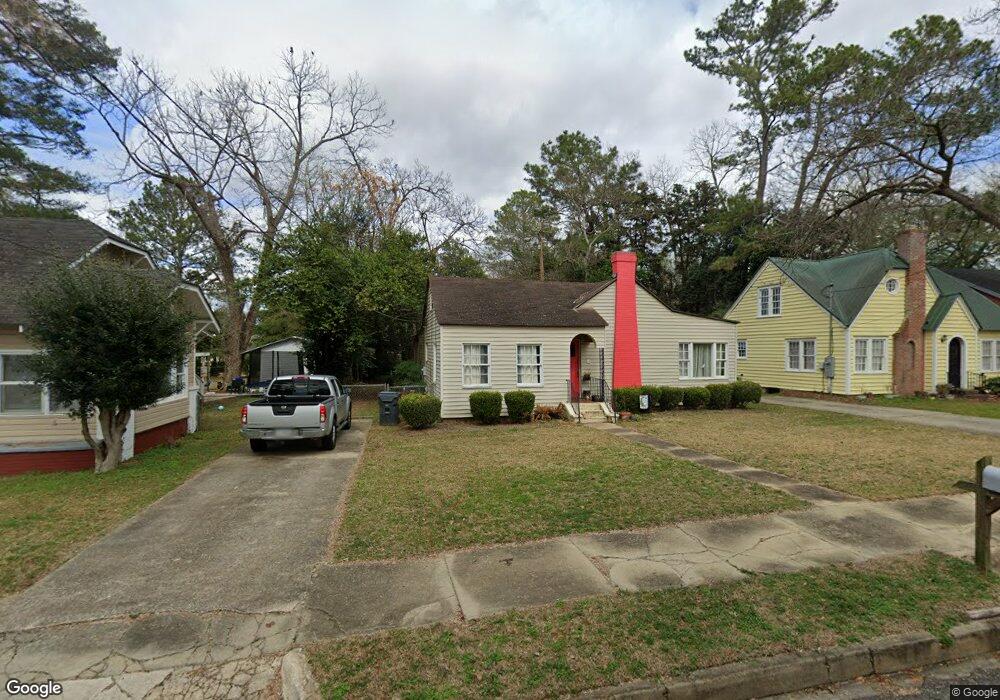
125 W Glessner St Americus, GA 31709
Estimated Value: $90,000 - $159,000
3
Beds
2
Baths
1,586
Sq Ft
$78/Sq Ft
Est. Value
About This Home
This home is located at 125 W Glessner St, Americus, GA 31709 and is currently estimated at $123,918, approximately $78 per square foot. 125 W Glessner St is a home located in Sumter County with nearby schools including Sumter County Primary School, Sumter County Elementary School, and Sumter County Middle School.
Ownership History
Date
Name
Owned For
Owner Type
Purchase Details
Closed on
Mar 14, 2018
Sold by
Kobs Kenton W
Bought by
Bowden Kristopher L
Current Estimated Value
Purchase Details
Closed on
Nov 30, 2012
Sold by
Nolan Christopher Scott
Bought by
Kobs Kenton W and Kobs Kirsty
Purchase Details
Closed on
Jun 25, 2012
Sold by
Nolan Charles
Bought by
Nolan Christopher Patrick
Purchase Details
Closed on
Sep 30, 2010
Sold by
Davis Mary Kathryn
Bought by
Nolan Angela C and Nolan Charles
Purchase Details
Closed on
Aug 24, 2000
Sold by
Wilson Sandra Smith
Bought by
Davis Mary Kathryn
Purchase Details
Closed on
Jun 28, 1999
Sold by
Burton Katie H
Bought by
Wilson Sandra Smith
Purchase Details
Closed on
Nov 2, 1987
Sold by
Burton J S
Bought by
Burton Katie H
Purchase Details
Closed on
Mar 1, 1932
Bought by
Burton J S
Create a Home Valuation Report for This Property
The Home Valuation Report is an in-depth analysis detailing your home's value as well as a comparison with similar homes in the area
Home Values in the Area
Average Home Value in this Area
Purchase History
| Date | Buyer | Sale Price | Title Company |
|---|---|---|---|
| Bowden Kristopher L | $40,000 | -- | |
| Kobs Kenton W | $30,000 | -- | |
| Nolan Christopher Patrick | -- | -- | |
| Nolan Angela C | $57,000 | -- | |
| Davis Mary Kathryn | $46,000 | -- | |
| Wilson Sandra Smith | -- | -- | |
| Burton Katie H | -- | -- | |
| Burton J S | -- | -- |
Source: Public Records
Mortgage History
| Date | Status | Borrower | Loan Amount |
|---|---|---|---|
| Closed | Kobs Kenton W | $0 |
Source: Public Records
Tax History Compared to Growth
Tax History
| Year | Tax Paid | Tax Assessment Tax Assessment Total Assessment is a certain percentage of the fair market value that is determined by local assessors to be the total taxable value of land and additions on the property. | Land | Improvement |
|---|---|---|---|---|
| 2024 | $1,079 | $23,920 | $2,480 | $21,440 |
| 2023 | $1,055 | $23,920 | $2,480 | $21,440 |
| 2022 | $723 | $23,920 | $2,480 | $21,440 |
| 2021 | $1,057 | $23,920 | $2,480 | $21,440 |
| 2020 | $1,082 | $23,920 | $2,480 | $21,440 |
| 2019 | $766 | $23,920 | $2,480 | $21,440 |
| 2018 | $752 | $23,920 | $2,480 | $21,440 |
| 2017 | $752 | $23,920 | $2,480 | $21,440 |
| 2016 | $1,057 | $23,920 | $2,480 | $21,440 |
| 2015 | $807 | $26,360 | $2,480 | $23,880 |
| 2014 | $808 | $26,360 | $2,480 | $23,880 |
| 2013 | -- | $25,720 | $2,480 | $23,240 |
Source: Public Records
Map
Nearby Homes
- 119 W Glessner St
- 127 W Glessner St
- 1108 Hancock Dr
- 117 W Glessner St
- 1107 Hancock Dr
- 1106 Hancock Dr
- 113 W Glessner St
- 1202 Hancock Dr
- 1109 Hancock Dr
- 124 W Glessner St
- 118 W Glessner St
- 204 W Glessner St
- 1203 Hancock Dr
- 1102 Hancock Dr
- 116 W Glessner St
- 1105 Hancock Dr
- 1121 S Lee St
- 1101 S Lee St
- 1115 S Lee St
- 1103 Hancock Dr