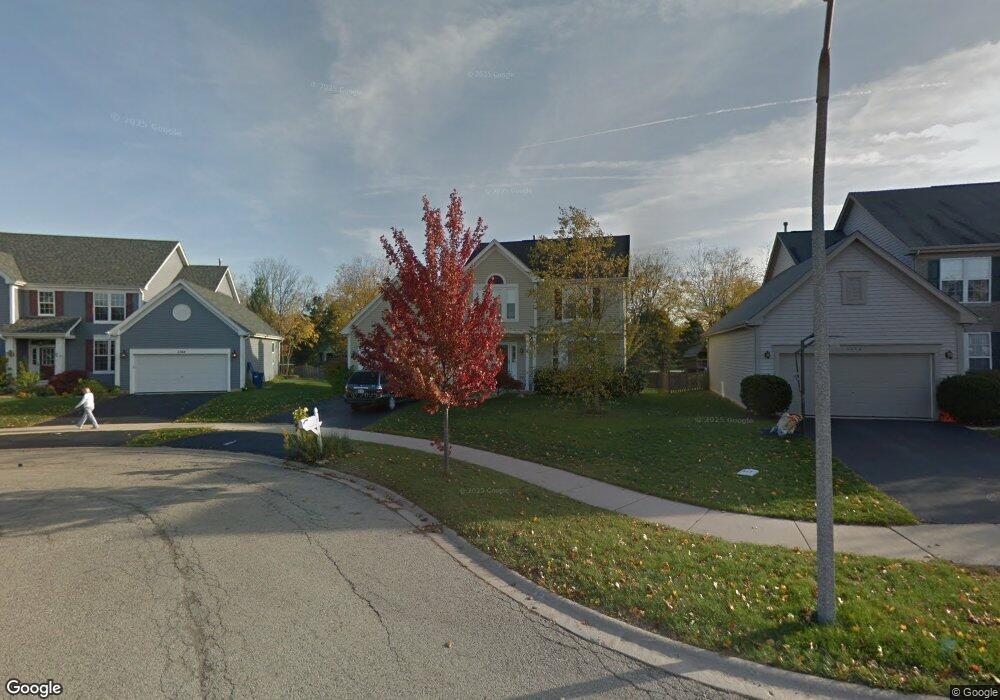
1250 Amaranth Dr Naperville, IL 60564
Far East NeighborhoodEstimated Value: $517,348 - $569,000
3
Beds
3
Baths
2,039
Sq Ft
$270/Sq Ft
Est. Value
About This Home
This home is located at 1250 Amaranth Dr, Naperville, IL 60564 and is currently estimated at $549,587, approximately $269 per square foot. 1250 Amaranth Dr is a home located in DuPage County with nearby schools including Owen Elementary School, Still Middle School, and Waubonsie Valley High School.
Ownership History
Date
Name
Owned For
Owner Type
Purchase Details
Closed on
Jun 25, 2008
Sold by
Standard Bank & Trust Co
Bought by
Hsu Chih Chi and Garcia Maria L
Current Estimated Value
Home Financials for this Owner
Home Financials are based on the most recent Mortgage that was taken out on this home.
Original Mortgage
$258,977
Outstanding Balance
$170,677
Interest Rate
6.5%
Mortgage Type
FHA
Estimated Equity
$378,910
Purchase Details
Closed on
Dec 6, 2006
Sold by
Salsman James Michael
Bought by
Triumph Lots Inc
Purchase Details
Closed on
Jul 17, 1996
Sold by
Wiseman Hughes Enterprises Inc
Bought by
Salsman James Michael and Salsman Regina L
Home Financials for this Owner
Home Financials are based on the most recent Mortgage that was taken out on this home.
Original Mortgage
$179,979
Interest Rate
8.43%
Mortgage Type
VA
Create a Home Valuation Report for This Property
The Home Valuation Report is an in-depth analysis detailing your home's value as well as a comparison with similar homes in the area
Home Values in the Area
Average Home Value in this Area
Purchase History
| Date | Buyer | Sale Price | Title Company |
|---|---|---|---|
| Hsu Chih Chi | $283,500 | First American Title | |
| Triumph Lots Inc | -- | None Available | |
| Salsman James Michael | $153,000 | -- |
Source: Public Records
Mortgage History
| Date | Status | Borrower | Loan Amount |
|---|---|---|---|
| Open | Hsu Chih Chi | $258,977 | |
| Previous Owner | Salsman James Michael | $179,979 |
Source: Public Records
Tax History
| Year | Tax Paid | Tax Assessment Tax Assessment Total Assessment is a certain percentage of the fair market value that is determined by local assessors to be the total taxable value of land and additions on the property. | Land | Improvement |
|---|---|---|---|---|
| 2024 | $10,698 | $140,704 | $29,659 | $111,045 |
| 2023 | $10,275 | $126,430 | $26,650 | $99,780 |
| 2022 | $9,791 | $116,760 | $24,400 | $92,360 |
| 2021 | $9,551 | $112,590 | $23,530 | $89,060 |
| 2020 | $9,668 | $112,590 | $23,530 | $89,060 |
| 2019 | $9,355 | $107,090 | $22,380 | $84,710 |
| 2018 | $9,327 | $105,600 | $21,580 | $84,020 |
| 2017 | $9,192 | $102,020 | $20,850 | $81,170 |
| 2016 | $9,053 | $97,910 | $20,010 | $77,900 |
| 2015 | $8,992 | $92,960 | $19,000 | $73,960 |
| 2014 | $8,550 | $85,810 | $17,400 | $68,410 |
| 2013 | $8,457 | $86,400 | $17,520 | $68,880 |
Source: Public Records
Map
Nearby Homes
- 4029 Broadmoor Cir
- 1348 Amaranth Dr
- 4474 Chelsea Manor Cir
- 3819 Cadella Cir
- 4263 Stableford Ln
- 4005 White Eagle Dr
- 4429 Chelsea Manor Cir
- 4167 Chelsea Manor Cir
- 4110 Chelsea Manor Cir
- 4122 Chelsea Manor Cir
- 4204 Chelsea Manor Cir
- 4139 Winslow Ct
- 4177 Irving Rd
- 3730 Baybrook Dr Unit 26
- 4196 Irving Rd
- 4158 Irving Rd
- 1576 Pine Lake Dr
- 857 Finley Dr
- 4203 Calder Ln
- 4213 Calder Ln
- 1256 Amaranth Dr
- 1244 Amaranth Dr
- 1262 Amaranth Dr Unit 1
- 1238 Amaranth Dr
- 1235 Amaranth Dr Unit 1
- 1232 Amaranth Dr
- 1245 Amaranth Dr
- 1268 Amaranth Dr
- 1205 Stonehaven Cir
- 1226 Amaranth Dr
- 1225 Amaranth Dr
- 1197 Stonehaven Cir
- 1274 Amaranth Dr
- 1213 Stonehaven Cir
- 1255 Amaranth Dr
- 4006 Broadmoor Cir Unit 1
- 1189 Stonehaven Cir
- 1220 Amaranth Dr
- 4012 Broadmoor Cir
- 1280 Amaranth Dr
Your Personal Tour Guide
Ask me questions while you tour the home.