1250 Elo Rd McCall, ID 83638
Estimated Value: $1,051,000 - $2,199,777
6
Beds
4
Baths
2,857
Sq Ft
$508/Sq Ft
Est. Value
About This Home
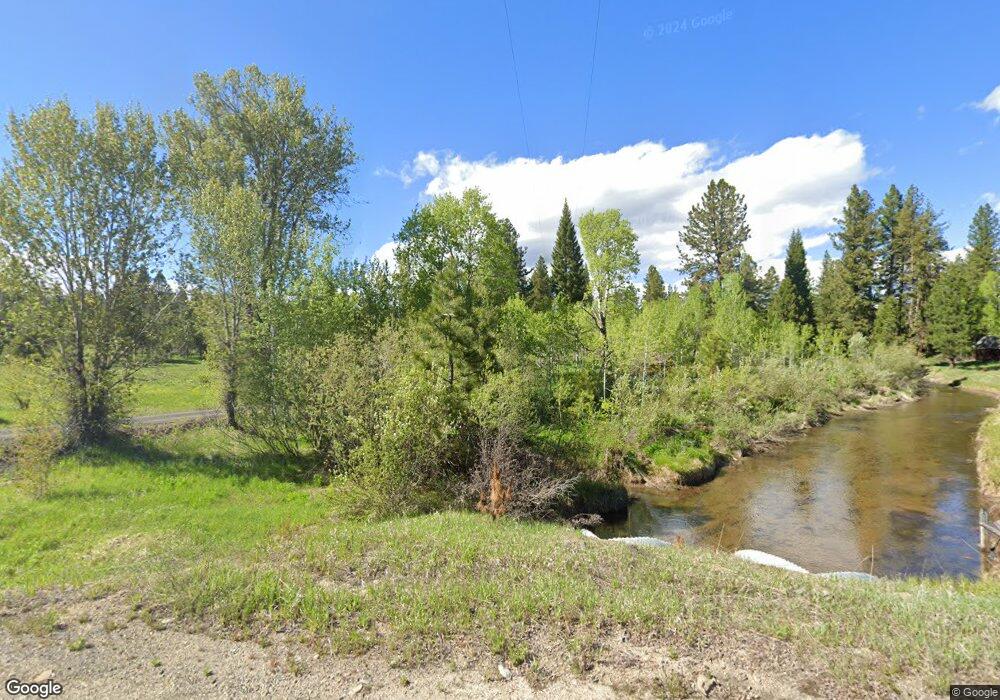
This home is located at 1250 Elo Rd, McCall, ID 83638 and is currently estimated at $1,451,926, approximately $508 per square foot. 1250 Elo Rd is a home located in Valley County with nearby schools including McCall-Donnelly High School, Mountain Life Education, and The North Fork School.
Ownership History
Date
Name
Owned For
Owner Type
Purchase Details
Closed on
Aug 23, 2013
Sold by
Magee John A and Magee Kay
Bought by
Ryno Works Inc
Current Estimated Value
Purchase Details
Closed on
Aug 26, 2007
Sold by
Miller Adrianne and Miller Ryan
Bought by
Miller Ryan
Home Financials for this Owner
Home Financials are based on the most recent Mortgage that was taken out on this home.
Original Mortgage
$228,073
Interest Rate
4.02%
Mortgage Type
New Conventional
Create a Home Valuation Report for This Property
The Home Valuation Report is an in-depth analysis detailing your home's value as well as a comparison with similar homes in the area
Home Values in the Area
Average Home Value in this Area
Purchase History
| Date | Buyer | Sale Price | Title Company |
|---|---|---|---|
| Ryno Works Inc | -- | Amerititle | |
| Miller Ryan | -- | -- |
Source: Public Records
Mortgage History
| Date | Status | Borrower | Loan Amount |
|---|---|---|---|
| Previous Owner | Miller Ryan | $228,073 |
Source: Public Records
Tax History
| Year | Tax Paid | Tax Assessment Tax Assessment Total Assessment is a certain percentage of the fair market value that is determined by local assessors to be the total taxable value of land and additions on the property. | Land | Improvement |
|---|---|---|---|---|
| 2025 | $4,286 | $2,061,872 | $347,019 | $1,714,853 |
| 2023 | $4,286 | $2,044,944 | $338,156 | $1,706,788 |
| 2022 | $4,784 | $1,933,902 | $306,598 | $1,627,304 |
| 2021 | $5,788 | $1,583,122 | $238,882 | $1,344,240 |
| 2020 | $5,549 | $1,279,123 | $201,198 | $1,077,925 |
| 2019 | $5,132 | $1,125,399 | $158,883 | $966,516 |
| 2018 | $5,276 | $1,054,145 | $145,462 | $908,683 |
| 2017 | $4,927 | $879,357 | $114,383 | $764,974 |
| 2016 | $4,270 | $760,425 | $144,993 | $615,432 |
| 2015 | $4,037 | $695,792 | $0 | $0 |
| 2013 | -- | $605,336 | $0 | $0 |
Source: Public Records
Map
Nearby Homes
- 1217 Elo Rd Unit 1
- 1217 Elo Rd
- TBD 2 Elo Rd
- TBD 5 Elo Rd
- 649 Brady Dr
- 14100 Pioneer Rd
- 162 Fox Ln
- 304 Samson Ct
- 304 Samson Ct Unit 656 Douglas Dr
- TBD Krahn Ln
- 14128 Jefferson Rd
- 644 Woodlands Dr
- 503 S Third St
- 413 S 3rd St
- 1510 S Samson Trail
- 13 Michelle Place
- 13 Michelle Place Unit 6
- 430 Ringel St
- 1130 Bell Flower Place
- 1034 Fireweed Dr
Your Personal Tour Guide
Ask me questions while you tour the home.