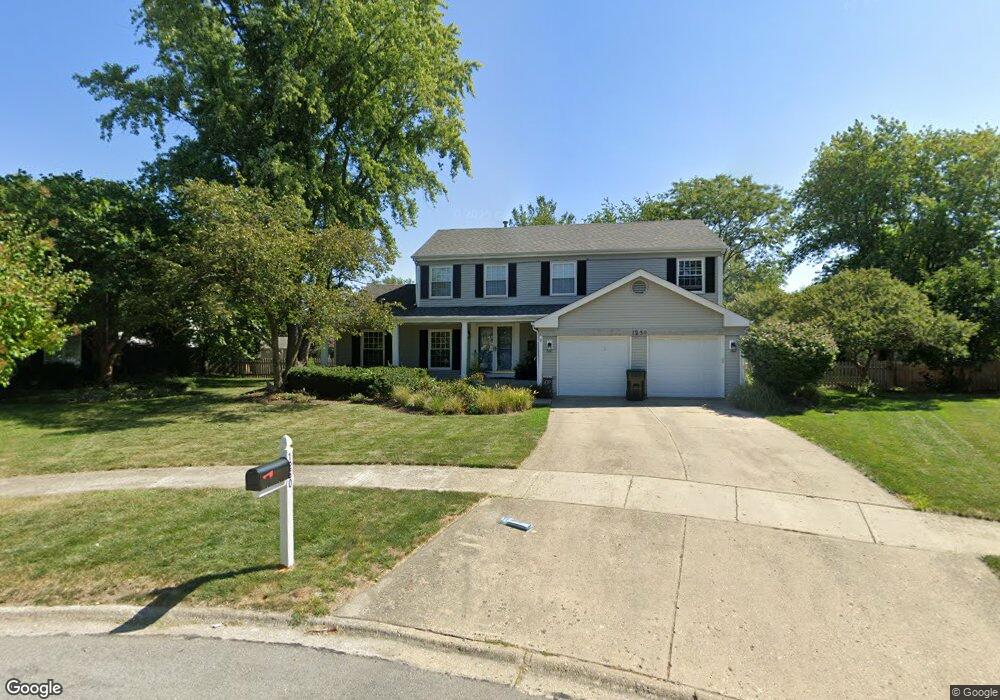
1250 Jasmine Ct Naperville, IL 60540
Watts NeighborhoodEstimated Value: $646,428 - $760,000
4
Beds
3
Baths
2,392
Sq Ft
$284/Sq Ft
Est. Value
About This Home
This home is located at 1250 Jasmine Ct, Naperville, IL 60540 and is currently estimated at $678,607, approximately $283 per square foot. 1250 Jasmine Ct is a home located in DuPage County with nearby schools including May Watts Elementary School, Thayer J. Hill Middle School, and Metea Valley High School.
Ownership History
Date
Name
Owned For
Owner Type
Purchase Details
Closed on
Feb 22, 2008
Sold by
Knott Nancy
Bought by
Hume Christopher and Hume Rachel
Current Estimated Value
Home Financials for this Owner
Home Financials are based on the most recent Mortgage that was taken out on this home.
Original Mortgage
$337,600
Interest Rate
5.94%
Mortgage Type
Purchase Money Mortgage
Purchase Details
Closed on
Jan 26, 2005
Sold by
Wisnosky Dennis E and Wisnosky Rosemary M
Bought by
Knott Nancy
Home Financials for this Owner
Home Financials are based on the most recent Mortgage that was taken out on this home.
Original Mortgage
$250,000
Interest Rate
4.25%
Mortgage Type
Purchase Money Mortgage
Purchase Details
Closed on
Nov 18, 1997
Sold by
Wisnosky Rosemary
Bought by
Wisnosky Dennis E and Wisnosky Rosemary M
Create a Home Valuation Report for This Property
The Home Valuation Report is an in-depth analysis detailing your home's value as well as a comparison with similar homes in the area
Home Values in the Area
Average Home Value in this Area
Purchase History
| Date | Buyer | Sale Price | Title Company |
|---|---|---|---|
| Hume Christopher | $422,000 | Regent Title Ins Agency Llc | |
| Knott Nancy | $370,000 | Wheatland Title | |
| Wisnosky Dennis E | -- | Law Title Pick Up |
Source: Public Records
Mortgage History
| Date | Status | Borrower | Loan Amount |
|---|---|---|---|
| Previous Owner | Hume Christopher | $337,600 | |
| Previous Owner | Knott Nancy | $250,000 |
Source: Public Records
Tax History
| Year | Tax Paid | Tax Assessment Tax Assessment Total Assessment is a certain percentage of the fair market value that is determined by local assessors to be the total taxable value of land and additions on the property. | Land | Improvement |
|---|---|---|---|---|
| 2024 | $11,081 | $185,531 | $56,546 | $128,985 |
| 2023 | $10,612 | $166,710 | $50,810 | $115,900 |
| 2022 | $10,406 | $158,260 | $47,870 | $110,390 |
| 2021 | $10,078 | $152,610 | $46,160 | $106,450 |
| 2020 | $10,064 | $152,610 | $46,160 | $106,450 |
| 2019 | $9,668 | $145,150 | $43,900 | $101,250 |
| 2018 | $9,228 | $136,360 | $41,490 | $94,870 |
| 2017 | $8,973 | $131,730 | $40,080 | $91,650 |
| 2016 | $8,809 | $126,420 | $38,460 | $87,960 |
| 2015 | $8,726 | $120,040 | $36,520 | $83,520 |
| 2014 | $8,552 | $113,890 | $34,390 | $79,500 |
| 2013 | $8,533 | $114,680 | $34,630 | $80,050 |
Source: Public Records
Map
Nearby Homes
- 690 Honeysuckle Dr
- 7S410 Arbor Dr
- 28W075 Aurora Ave
- 7S146 Wild Cherry Rd
- 1095 Devonshire Ave
- 1524 Oswego Rd
- 615 Windridge Ct
- 1528 Sequoia Rd
- 212 S River Rd
- 417 River Bluff Cir
- 401 S Whispering Hills Dr
- 208 S Birchwood Dr
- 1269 Rhodes Ln Unit 1306
- 530 River Front Cir Unit 608
- 906 Sumter Ct Unit 4
- 128 S Birchwood Dr
- 1226 Rhodes Ln Unit 2508
- 511 Aurora Ave Unit 620
- 511 Aurora Ave Unit 606
- 511 Aurora Ave Unit 507
- 1255 Jasmine Ct Unit 1
- 1254 Jasmine Ct
- 625 Joshua Ct
- 1259 Jasmine Ct
- 705 Buttonwood Cir
- 1258 Jasmine Ct
- 709 Buttonwood Cir
- 629 Joshua Ct
- 1263 Jasmine Ct
- 678 Honeysuckle Dr
- 708 Honeysuckle Dr
- 734 S River Rd
- 682 Honeysuckle Dr
- 738 S River Rd
- 617 Joshua Ct
- 713 Buttonwood Cir
- 730 S River Rd
- 674 Honeysuckle Dr
- 716 Honeysuckle Dr
- 613 Joshua Ct
Your Personal Tour Guide
Ask me questions while you tour the home.