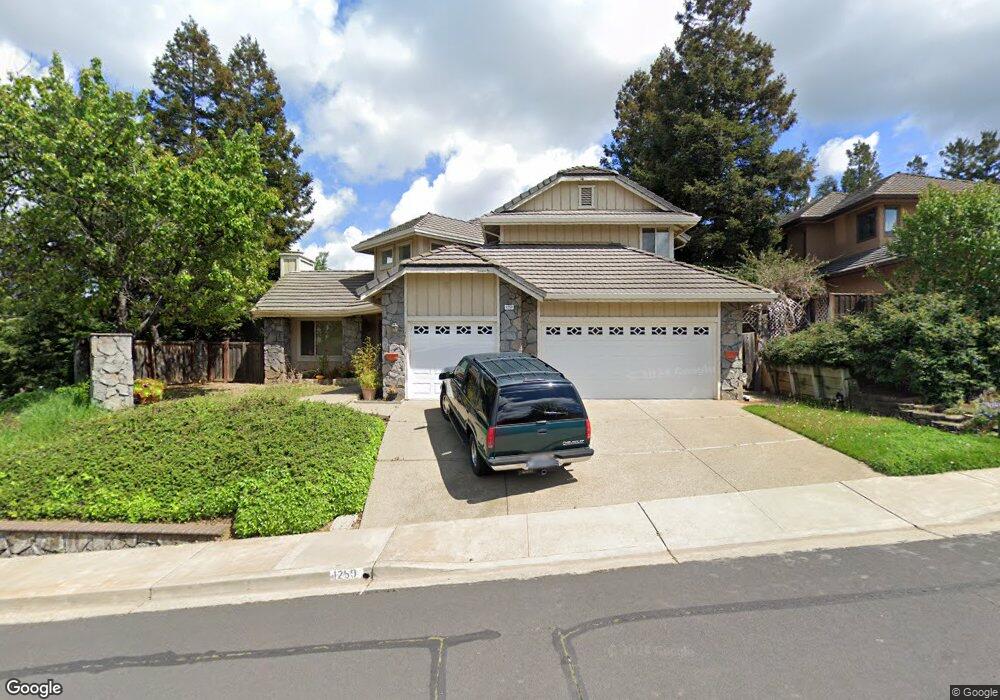
1250 Pine Shadow Ln Concord, CA 94521
The Highlands NeighborhoodEstimated Value: $1,000,000 - $1,208,000
4
Beds
3
Baths
2,421
Sq Ft
$445/Sq Ft
Est. Value
About This Home
This home is located at 1250 Pine Shadow Ln, Concord, CA 94521 and is currently estimated at $1,077,826, approximately $445 per square foot. 1250 Pine Shadow Ln is a home located in Contra Costa County with nearby schools including Mt. Diablo Elementary School, Diablo View Middle School, and College Park High School.
Ownership History
Date
Name
Owned For
Owner Type
Purchase Details
Closed on
Feb 5, 1999
Sold by
Tyler Steven C and Tyler Maryann C
Bought by
Jurkovich Robert W
Current Estimated Value
Home Financials for this Owner
Home Financials are based on the most recent Mortgage that was taken out on this home.
Original Mortgage
$276,000
Outstanding Balance
$65,103
Interest Rate
6.7%
Mortgage Type
Purchase Money Mortgage
Estimated Equity
$1,012,723
Purchase Details
Closed on
Apr 8, 1996
Sold by
Yaron George D and Yaron Shelly M
Bought by
Tyler Steven C and Tyler Maryann C
Home Financials for this Owner
Home Financials are based on the most recent Mortgage that was taken out on this home.
Original Mortgage
$270,000
Interest Rate
7.41%
Mortgage Type
Purchase Money Mortgage
Create a Home Valuation Report for This Property
The Home Valuation Report is an in-depth analysis detailing your home's value as well as a comparison with similar homes in the area
Home Values in the Area
Average Home Value in this Area
Purchase History
| Date | Buyer | Sale Price | Title Company |
|---|---|---|---|
| Jurkovich Robert W | $345,000 | Fidelity National Title Co | |
| Tyler Steven C | $300,500 | American Title Ins Co |
Source: Public Records
Mortgage History
| Date | Status | Borrower | Loan Amount |
|---|---|---|---|
| Open | Jurkovich Robert W | $276,000 | |
| Previous Owner | Tyler Steven C | $270,000 | |
| Closed | Jurkovich Robert W | $15,000 |
Source: Public Records
Tax History
| Year | Tax Paid | Tax Assessment Tax Assessment Total Assessment is a certain percentage of the fair market value that is determined by local assessors to be the total taxable value of land and additions on the property. | Land | Improvement |
|---|---|---|---|---|
| 2025 | $6,901 | $540,836 | $204,573 | $336,263 |
| 2024 | $6,588 | $530,232 | $200,562 | $329,670 |
| 2023 | $6,588 | $519,836 | $196,630 | $323,206 |
| 2022 | $6,495 | $509,644 | $192,775 | $316,869 |
| 2021 | $6,331 | $499,652 | $188,996 | $310,656 |
| 2019 | $6,205 | $484,835 | $183,392 | $301,443 |
| 2018 | $5,967 | $475,330 | $179,797 | $295,533 |
| 2017 | $5,765 | $466,011 | $176,272 | $289,739 |
| 2016 | $5,602 | $456,874 | $172,816 | $284,058 |
| 2015 | $5,534 | $450,013 | $170,221 | $279,792 |
| 2014 | $5,434 | $441,199 | $166,887 | $274,312 |
Source: Public Records
Map
Nearby Homes
- 5722 Roanwood Way
- 1367 Yosemite Cir
- 5549 Alabama Dr
- 5500 Lewis Way
- 5817 Mitchell Canyon Ct
- 5510 Alaska Dr
- 5900 High St
- 5492 Roundtree Dr Unit A
- 5468 Roundtree Dr Unit C
- 1271 Kentucky Dr
- 57 Karkin Place
- 35 Jalalon Place
- 5451 Roundtree Place
- 1833 Camino Estrada
- 5434 Roundtree Ct Unit A
- 1280 Shell Cir
- 5460 Concord Blvd Unit E4
- 1160 Kenwal Rd Unit D
- 1120 Kenwal Rd Unit C
- 5333 Park Highlands Blvd Unit 27
- 1246 Pine Shadow Ln
- 1255 Classic Way
- 1242 Pine Shadow Ln
- 1251 Pine Shadow Ln
- 1249 Classic Way
- 1310 El Camino Dr
- 1247 Pine Shadow Ln
- 5639 Pine Hollow Rd
- 5645 Pine Hollow Rd
- 5578 Pine Hollow Rd
- 1230 Pine Shadow Ln
- 1238 Pine Shadow Ln
- 1234 Pine Shadow Ln
- 1243 Classic Way
- 1243 Pine Shadow Ln
- 1235 Pine Shadow Ln
- 1317 El Camino Dr
- 1324 Yosemite Cir
- 1330 Yosemite Cir
- 1239 Pine Shadow Ln
Your Personal Tour Guide
Ask me questions while you tour the home.