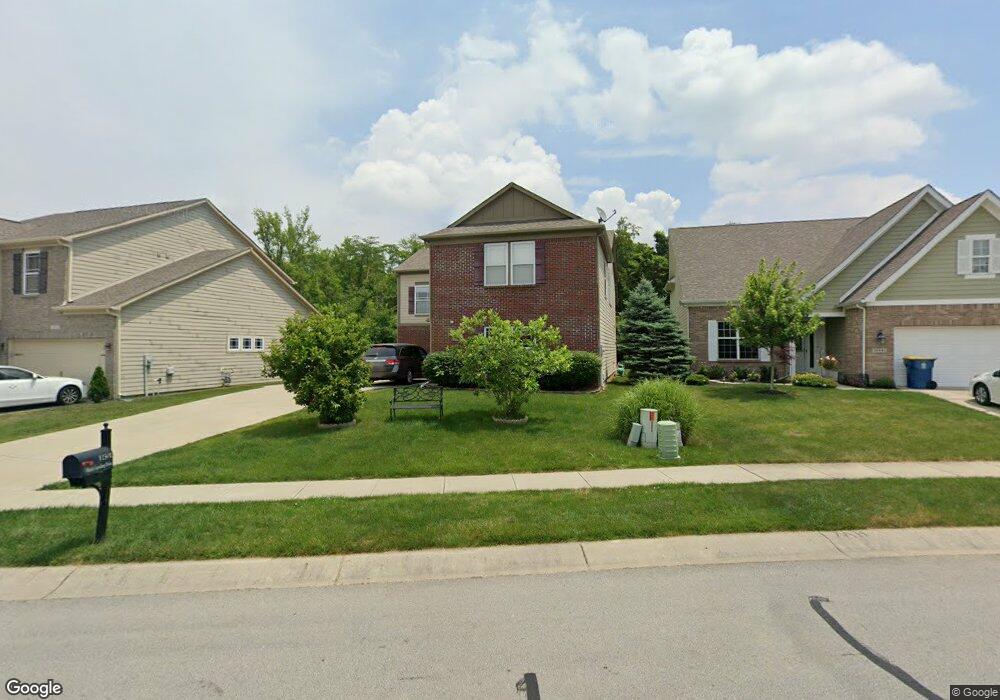
12501 Hawks Landing Fishers, IN 46037
Estimated Value: $367,171 - $416,000
3
Beds
3
Baths
2,215
Sq Ft
$173/Sq Ft
Est. Value
About This Home
This home is located at 12501 Hawks Landing, Fishers, IN 46037 and is currently estimated at $384,293, approximately $173 per square foot. 12501 Hawks Landing is a home located in Hamilton County with nearby schools including Fall Creek Elementary School, Fall Creek Intermediate School, and Hamilton Southeastern High School.
Ownership History
Date
Name
Owned For
Owner Type
Purchase Details
Closed on
Aug 16, 2018
Sold by
Nguyen Phin T and Ngo Nga T
Bought by
Yekasi Venkata R
Current Estimated Value
Home Financials for this Owner
Home Financials are based on the most recent Mortgage that was taken out on this home.
Original Mortgage
$174,400
Outstanding Balance
$151,459
Interest Rate
4.5%
Mortgage Type
New Conventional
Estimated Equity
$232,834
Purchase Details
Closed on
Nov 18, 2010
Sold by
M&I Bank
Bought by
Pyatt Builders Llc
Purchase Details
Closed on
Jun 17, 2010
Sold by
Gsl&C Llc
Bought by
M&I Bank
Purchase Details
Closed on
Aug 28, 2006
Sold by
G & L Development Co Inc
Bought by
Bruce Gunstra Builders Inc
Purchase Details
Closed on
Jan 13, 2006
Sold by
Crawfordsville Partners Llc
Bought by
G & L Development Co Inc
Create a Home Valuation Report for This Property
The Home Valuation Report is an in-depth analysis detailing your home's value as well as a comparison with similar homes in the area
Home Values in the Area
Average Home Value in this Area
Purchase History
| Date | Buyer | Sale Price | Title Company |
|---|---|---|---|
| Yekasi Venkata R | -- | None Available | |
| Pyatt Builders Llc | -- | None Available | |
| M&I Bank | $20,000 | None Available | |
| Bruce Gunstra Builders Inc | -- | None Available | |
| G & L Development Co Inc | -- | None Available |
Source: Public Records
Mortgage History
| Date | Status | Borrower | Loan Amount |
|---|---|---|---|
| Open | Yekasi Venkata R | $174,400 |
Source: Public Records
Tax History Compared to Growth
Tax History
| Year | Tax Paid | Tax Assessment Tax Assessment Total Assessment is a certain percentage of the fair market value that is determined by local assessors to be the total taxable value of land and additions on the property. | Land | Improvement |
|---|---|---|---|---|
| 2024 | $5,959 | $281,100 | $53,800 | $227,300 |
| 2023 | $5,959 | $275,000 | $53,800 | $221,200 |
| 2022 | $5,385 | $240,900 | $53,800 | $187,100 |
| 2021 | $4,896 | $214,800 | $53,800 | $161,000 |
| 2020 | $4,688 | $202,900 | $53,800 | $149,100 |
| 2019 | $4,749 | $204,600 | $53,800 | $150,800 |
| 2018 | $2,172 | $192,300 | $53,800 | $138,500 |
| 2017 | $1,778 | $167,300 | $53,800 | $113,500 |
| 2016 | $1,714 | $163,700 | $53,800 | $109,900 |
| 2014 | $1,652 | $168,700 | $53,800 | $114,900 |
| 2013 | $1,652 | $173,500 | $53,800 | $119,700 |
Source: Public Records
Map
Nearby Homes
- 12438 Hawks Landing Dr
- 12089 Red Hawk Dr
- 12680 Tamworth Dr
- 12706 Hannah Hill Rd
- 12880 Oxbridge Place
- 11833 Walker Ln
- 12985 Saxony Blvd
- 13008 Overview Dr
- 12419 Brandamore Ln
- 14058 Southwood Cir
- 10725 Crum Ct
- 12878 Ari Ln
- 13616 Whitten Dr N
- 13311 Susser Way
- 14156 Avalon Dr E
- 13288 E Lieder Way
- 13276 E Lieder Way
- 13172 Saxony Blvd
- 12997 Bartlett Dr
- 11932 Hollyhock Dr
- 12501 Hawks Landing Dr
- 12491 Hawks Landing
- 12491 Hawks Landing Dr
- 12511 Hawks Landing
- 12511 Hawks Landing Dr
- 12481 Hawks Landing Dr
- 12481 Hawks Landing
- 12521 Hawks Landing
- 12471 Hawks Landing
- 12531 Hawks Landing
- 12531 Hawks Landing Dr
- 12478 Hawks Landing Dr
- 12478 Hawks Landing
- 12541 Hawks Landing
- 12461 Hawks Landing
- 12468 Hawks Landing
- 12551 Hawks Landing
- 12451 Hawks Landing Dr
- 12451 Hawks Landing
- 12458 Hawks Landing Dr