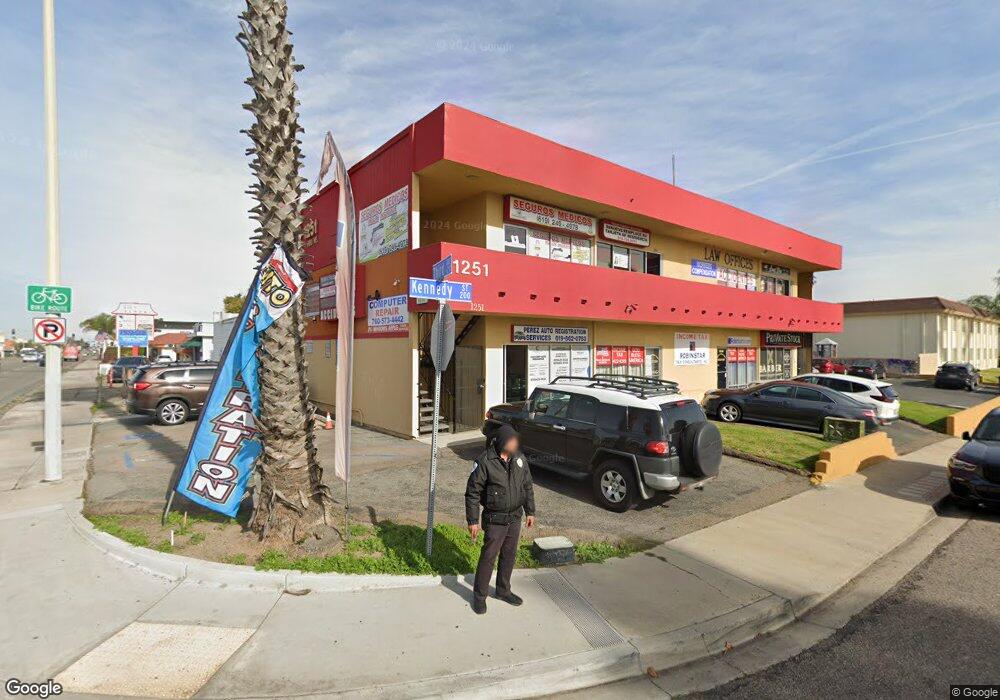
1251 3rd Ave Chula Vista, CA 91911
Castle Park NeighborhoodEstimated Value: $1,484,369
--
Bed
5
Baths
4,480
Sq Ft
$331/Sq Ft
Est. Value
About This Home
This home is located at 1251 3rd Ave, Chula Vista, CA 91911 and is currently estimated at $1,484,369, approximately $331 per square foot. 1251 3rd Ave is a home located in San Diego County with nearby schools including J. Calvin Lauderbach Elemenentary School, Castle Park Middle School, and Castle Park High School.
Ownership History
Date
Name
Owned For
Owner Type
Purchase Details
Closed on
Apr 10, 2024
Sold by
Ghobril Michel and Ghobril Mireille
Bought by
Ghobril Revocable Living Trust and Ghobril
Current Estimated Value
Purchase Details
Closed on
Sep 10, 2013
Sold by
Long Perry
Bought by
Ghobril Michel and Ghobril Mireille
Home Financials for this Owner
Home Financials are based on the most recent Mortgage that was taken out on this home.
Original Mortgage
$350,000
Interest Rate
4.55%
Mortgage Type
Commercial
Purchase Details
Closed on
Feb 18, 2011
Sold by
Long Perry D and Long Carri J
Bought by
Long Perry
Purchase Details
Closed on
May 8, 2003
Sold by
Craycroft Wayne H
Bought by
Long Perry D and Long Carri J
Home Financials for this Owner
Home Financials are based on the most recent Mortgage that was taken out on this home.
Original Mortgage
$420,000
Interest Rate
5.18%
Mortgage Type
Commercial
Purchase Details
Closed on
Nov 26, 1991
Purchase Details
Closed on
Jul 15, 1988
Create a Home Valuation Report for This Property
The Home Valuation Report is an in-depth analysis detailing your home's value as well as a comparison with similar homes in the area
Home Values in the Area
Average Home Value in this Area
Purchase History
| Date | Buyer | Sale Price | Title Company |
|---|---|---|---|
| Ghobril Revocable Living Trust | -- | None Listed On Document | |
| Ghobril Michel | $697,000 | Fidelity National Title Co | |
| Long Perry | -- | None Available | |
| Long Perry D | $600,000 | Chicago Title Co | |
| -- | $450,000 | -- | |
| -- | $440,000 | -- |
Source: Public Records
Mortgage History
| Date | Status | Borrower | Loan Amount |
|---|---|---|---|
| Previous Owner | Ghobril Michel | $350,000 | |
| Previous Owner | Long Perry D | $420,000 |
Source: Public Records
Tax History Compared to Growth
Tax History
| Year | Tax Paid | Tax Assessment Tax Assessment Total Assessment is a certain percentage of the fair market value that is determined by local assessors to be the total taxable value of land and additions on the property. | Land | Improvement |
|---|---|---|---|---|
| 2025 | $12,053 | $854,416 | $315,042 | $539,374 |
| 2024 | $12,053 | $837,664 | $308,865 | $528,799 |
| 2023 | $11,660 | $821,240 | $302,809 | $518,431 |
| 2022 | $11,251 | $805,138 | $296,872 | $508,266 |
| 2021 | $10,990 | $789,351 | $291,051 | $498,300 |
| 2020 | $10,766 | $781,258 | $288,067 | $493,191 |
| 2019 | $10,565 | $765,940 | $282,419 | $483,521 |
| 2018 | $10,481 | $750,923 | $276,882 | $474,041 |
| 2017 | $13 | $736,200 | $271,453 | $464,747 |
| 2016 | $9,866 | $721,766 | $266,131 | $455,635 |
| 2015 | $9,771 | $710,925 | $262,134 | $448,791 |
| 2014 | $8,948 | $697,000 | $257,000 | $440,000 |
Source: Public Records
Map
Nearby Homes
- 361 Oxford St
- 1148 Third Ave Unit 10
- 1332 La Tempra Corte
- 1252 4th Ave
- 1148 3rd Ave Unit 28
- 1148 3rd Ave Unit 58
- 1148 3rd Ave Unit 39
- 421 Locdel Ct
- 271-73 Quintard St
- 1385 4th Ave
- 1325 1st Ave
- 1029 4th Ave
- 345 Moss St Unit 8
- 1236 Tobias Dr
- 1308 Dixon Ct
- 445 Orange Ave Unit 29
- 445 Orange Ave Unit 24
- 1425 2nd Ave Unit 88
- 1425 Second Ave
- 1500 Third Ave Unit 93
- 1249 3rd Ave
- 1231 1231 3 Rd Ave Ste F
- 1242 3rd Ave Unit 52
- 1227 3 Ave
- 1231 Third Ave Unit F
- 1231 Third Ave Unit C
- 1231 Third Ave
- 1229 3rd Ave Unit D
- 1229 3rd Ave Unit A
- 1229 3rd Ave
- 1231 3rd Ave
- 1231 1231 3rd #C
- 1231 1231 3rd Ave Ste E
- 1227 3rd Ave
- 1229 1229 3 Ave # A
- 1229 1229 3rd Ave Suite F
- 1229 1229 3rd Ave Suite E
- 1229 1229 3rd Ave Ste C
- 1229 1229 3rd Ave
- 1229 1229 3 Rd Ave Ste D