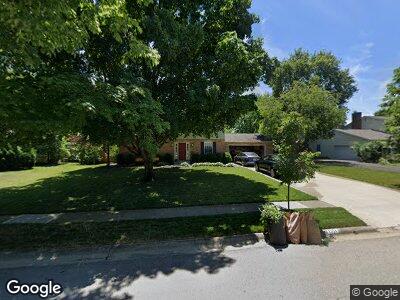
1251 Darcann Dr Columbus, OH 43220
Estimated Value: $605,000 - $740,000
4
Beds
3
Baths
2,120
Sq Ft
$314/Sq Ft
Est. Value
About This Home
This home is located at 1251 Darcann Dr, Columbus, OH 43220 and is currently estimated at $666,007, approximately $314 per square foot. 1251 Darcann Dr is a home located in Franklin County with nearby schools including Greensview Elementary School, Hastings Middle School, and Upper Arlington High School.
Ownership History
Date
Name
Owned For
Owner Type
Purchase Details
Closed on
Nov 22, 2010
Sold by
Spellacy Megan M
Bought by
Oswald Joshua K and Oswald Paula R
Current Estimated Value
Home Financials for this Owner
Home Financials are based on the most recent Mortgage that was taken out on this home.
Original Mortgage
$285,000
Interest Rate
4.17%
Mortgage Type
New Conventional
Purchase Details
Closed on
May 10, 1999
Sold by
Annis Gerald L and Annis Dianne D
Bought by
Spellacy Megan M
Home Financials for this Owner
Home Financials are based on the most recent Mortgage that was taken out on this home.
Original Mortgage
$156,100
Interest Rate
7.04%
Purchase Details
Closed on
Aug 17, 1990
Bought by
Annis Gerald L and Annis Dianne D
Create a Home Valuation Report for This Property
The Home Valuation Report is an in-depth analysis detailing your home's value as well as a comparison with similar homes in the area
Home Values in the Area
Average Home Value in this Area
Purchase History
| Date | Buyer | Sale Price | Title Company |
|---|---|---|---|
| Oswald Joshua K | $300,000 | Talon Group | |
| Spellacy Megan M | $223,000 | Franklin Abstract | |
| Annis Gerald L | -- | -- |
Source: Public Records
Mortgage History
| Date | Status | Borrower | Loan Amount |
|---|---|---|---|
| Open | Oswald Joshua K | $50,000 | |
| Open | Oswald Joshua K | $217,311 | |
| Closed | Oswald Joshua K | $35,000 | |
| Closed | Oswald Joshua K | $278,000 | |
| Closed | Oswald Joshua K | $285,000 | |
| Closed | Spellacy Megan M | $84,200 | |
| Closed | Spellacy Megan M | $156,100 |
Source: Public Records
Tax History Compared to Growth
Tax History
| Year | Tax Paid | Tax Assessment Tax Assessment Total Assessment is a certain percentage of the fair market value that is determined by local assessors to be the total taxable value of land and additions on the property. | Land | Improvement |
|---|---|---|---|---|
| 2024 | $11,310 | $195,370 | $86,030 | $109,340 |
| 2023 | $11,170 | $195,370 | $86,030 | $109,340 |
| 2022 | $8,842 | $126,530 | $50,230 | $76,300 |
| 2021 | $7,827 | $126,530 | $50,230 | $76,300 |
| 2020 | $7,757 | $126,530 | $50,230 | $76,300 |
| 2019 | $7,495 | $108,090 | $50,230 | $57,860 |
| 2018 | $7,351 | $108,090 | $50,230 | $57,860 |
| 2017 | $7,346 | $108,090 | $50,230 | $57,860 |
| 2016 | $7,255 | $109,730 | $41,270 | $68,460 |
| 2015 | $7,249 | $109,730 | $41,270 | $68,460 |
| 2014 | $7,257 | $109,730 | $41,270 | $68,460 |
| 2013 | $3,465 | $99,750 | $37,520 | $62,230 |
Source: Public Records
Map
Nearby Homes
- 1330 Darcann Dr
- 1211 Darcann Dr
- 4216 Chaucer Ln
- 1293 Ducrest Dr S
- 1371 Reymond Rd
- 1225 Brittany Ln
- 975 Kennington Ave
- 1610 Lafayette Dr Unit 1610
- 1680 Sussex Ct
- 4644 NW Professional Plaza
- 4070 Lyon Dr
- 4460 Reed Rd
- 4230 Reed Rd
- 3823 Beecham Ct
- 1155 Millcreek Ct
- 4883 McBane St
- 1004 Kenwood Ln
- 4188 Gavin Ln
- 3982 Pegg Ave
- 685 Olde Settler Place
- 1251 Darcann Dr
- 1263 Darcann Dr
- 1237 Darcann Dr
- 1248 Langston Dr
- 1260 Langston Dr
- 1236 Langston Dr
- 1275 Darcann Dr
- 1225 Darcann Dr
- 1260 Darcann Dr
- 1248 Darcann Dr
- 1224 Langston Dr
- 1274 Langston Dr
- 1272 Darcann Dr
- 1236 Darcann Dr
- 1287 Darcann Dr
- 1284 Darcann Dr
- 1286 Langston Dr
- 1212 Langston Dr
- 1224 Darcann Dr
- 1257 Windham Rd