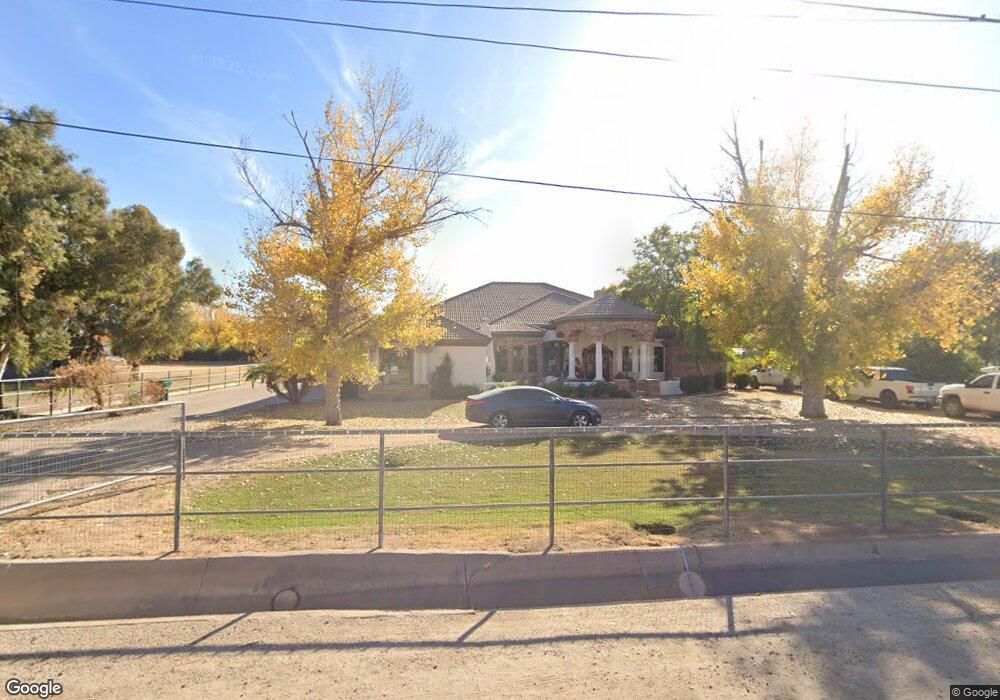
12521 E Via de Palmas Chandler, AZ 85249
South Chandler NeighborhoodEstimated Value: $1,500,000 - $1,656,285
4
Beds
5
Baths
4,365
Sq Ft
$364/Sq Ft
Est. Value
About This Home
This home is located at 12521 E Via de Palmas, Chandler, AZ 85249 and is currently estimated at $1,590,428, approximately $364 per square foot. 12521 E Via de Palmas is a home located in Maricopa County with nearby schools including Jane D. Hull Elementary School, Santan Junior High School, and BASIS Chandler.
Ownership History
Date
Name
Owned For
Owner Type
Purchase Details
Closed on
Aug 31, 2010
Sold by
Pack Dana E and Pack Elena
Bought by
Bueler Gordon and Bueler Shannon
Current Estimated Value
Home Financials for this Owner
Home Financials are based on the most recent Mortgage that was taken out on this home.
Original Mortgage
$310,000
Outstanding Balance
$205,429
Interest Rate
4.51%
Mortgage Type
New Conventional
Estimated Equity
$1,384,999
Purchase Details
Closed on
Oct 6, 2005
Sold by
Borkenhagen Dennis and Tafoya Jennifer
Bought by
Kubal Terry and Kubal Ashley
Home Financials for this Owner
Home Financials are based on the most recent Mortgage that was taken out on this home.
Original Mortgage
$650,000
Interest Rate
5.75%
Mortgage Type
New Conventional
Purchase Details
Closed on
May 4, 2001
Sold by
Huso Jani and Harvill Jani
Bought by
Borkenhagen Dennis and Tafoya Jennifer
Create a Home Valuation Report for This Property
The Home Valuation Report is an in-depth analysis detailing your home's value as well as a comparison with similar homes in the area
Home Values in the Area
Average Home Value in this Area
Purchase History
| Date | Buyer | Sale Price | Title Company |
|---|---|---|---|
| Bueler Gordon | $460,000 | Security Title Agency | |
| Kubal Terry | $990,000 | Capital Title Agency Inc | |
| Borkenhagen Dennis | $99,500 | Lawyers Title Of Arizona Inc |
Source: Public Records
Mortgage History
| Date | Status | Borrower | Loan Amount |
|---|---|---|---|
| Open | Bueler Gordon | $310,000 | |
| Previous Owner | Kubal Terry | $650,000 |
Source: Public Records
Tax History Compared to Growth
Tax History
| Year | Tax Paid | Tax Assessment Tax Assessment Total Assessment is a certain percentage of the fair market value that is determined by local assessors to be the total taxable value of land and additions on the property. | Land | Improvement |
|---|---|---|---|---|
| 2025 | $6,881 | $72,828 | -- | -- |
| 2024 | $6,515 | $69,360 | -- | -- |
| 2023 | $6,515 | $108,080 | $21,610 | $86,470 |
| 2022 | $6,214 | $79,860 | $15,970 | $63,890 |
| 2021 | $6,387 | $74,180 | $14,830 | $59,350 |
| 2020 | $6,386 | $72,650 | $14,530 | $58,120 |
| 2019 | $6,129 | $67,120 | $13,420 | $53,700 |
| 2018 | $5,934 | $57,870 | $11,570 | $46,300 |
| 2017 | $5,570 | $56,000 | $11,200 | $44,800 |
| 2016 | $5,257 | $57,630 | $11,520 | $46,110 |
| 2015 | $5,059 | $55,320 | $11,060 | $44,260 |
Source: Public Records
Map
Nearby Homes
- 12548 E Cloud Rd
- 127XX E Via de Arboles --
- 12417 E Cloud Rd
- 12417 E Cloud Rd
- 23724 S 126th St
- 12520 E Victoria - Lot 3 St Unit 1
- 12520 E Victoria - Lot 4 St Unit 1
- 12230 E Wood Dr Unit T
- 12520 E Victoria - Lot 2 St Unit 1
- 23811 S Cooper Rd
- 12520 E Victoria St Unit 1
- 12622 E Victoria St
- 12840 E Via de Palmas --
- 1320 E Beechnut Place
- 2069 E Cedar Place
- 1873 E San Carlos Place
- 224XX S Cooper Rd
- 1937 E Victoria St
- 2137 E Teakwood Place
- 1161 E Birchwood Place
- 12523 E Via de Palmas
- 12519 E Via de Palmas
- 12532 E Vía de Palmas
- 12502 E Via de Arboles
- 12532 E Via de Palmas
- 12607 E Via de Palmas
- 12503 E Via de Palmas
- 12548 E Via de Arboles
- 12510 E Via de Arboles
- 12520 E Via de Palmas
- 12548 E Via de Palmas
- 12602 E Via de Palmas
- 12612 E Via de Arboles
- 12506 E Via de Palmas
- 12623 E Via de Palmas
- 12623 E Via de Palmas --
- 12623 E Via de Palmas --
- 12521 E Via de Arboles
- 12448 E Via de Arboles
- 12531 E Vía de Arboles