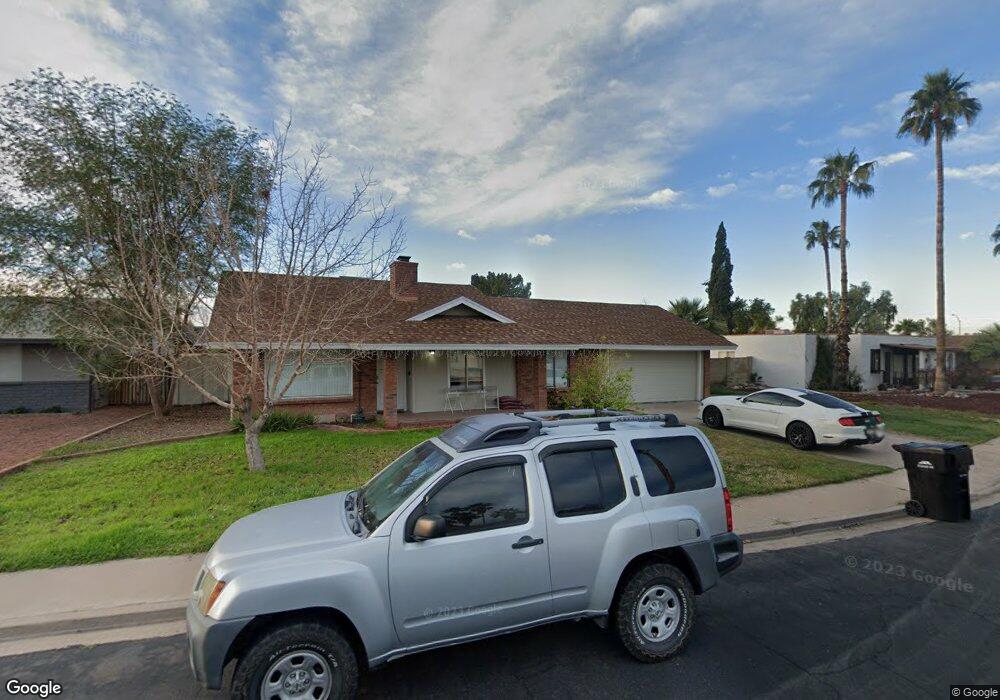
1253 E Indigo St Mesa, AZ 85203
North Central Mesa NeighborhoodEstimated Value: $353,000 - $453,000
Studio
2
Baths
1,464
Sq Ft
$278/Sq Ft
Est. Value
About This Home
This home is located at 1253 E Indigo St, Mesa, AZ 85203 and is currently estimated at $407,406, approximately $278 per square foot. 1253 E Indigo St is a home located in Maricopa County with nearby schools including Macarthur Elementary School, Franklin at Brimhall Elementary School, and Franklin West Elementary School.
Ownership History
Date
Name
Owned For
Owner Type
Purchase Details
Closed on
Apr 5, 2022
Sold by
Lebaron Robin E
Bought by
Vaisvil Brendan
Current Estimated Value
Home Financials for this Owner
Home Financials are based on the most recent Mortgage that was taken out on this home.
Original Mortgage
$430,557
Outstanding Balance
$404,046
Interest Rate
4.16%
Mortgage Type
FHA
Estimated Equity
$3,360
Purchase Details
Closed on
Jun 24, 2019
Sold by
Lebaron Ronald C and Lebaron Robin E
Bought by
Lebaron Robin E
Purchase Details
Closed on
Mar 28, 2017
Sold by
Johnson Robin
Bought by
Lebaron Ronald and Lebaron Robin
Purchase Details
Closed on
Nov 6, 2002
Sold by
Lauritzen Richard J
Bought by
Johnson Robin E
Home Financials for this Owner
Home Financials are based on the most recent Mortgage that was taken out on this home.
Original Mortgage
$112,000
Interest Rate
5.88%
Mortgage Type
New Conventional
Purchase Details
Closed on
Apr 27, 1999
Sold by
Lauritzen Sherri
Bought by
Lauritzen Richard J
Purchase Details
Closed on
Mar 7, 1996
Sold by
Phelps Jerry W and Phelps Rebecca
Bought by
Lauritzen Richard J
Home Financials for this Owner
Home Financials are based on the most recent Mortgage that was taken out on this home.
Original Mortgage
$92,150
Interest Rate
7.41%
Mortgage Type
New Conventional
Create a Home Valuation Report for This Property
The Home Valuation Report is an in-depth analysis detailing your home's value as well as a comparison with similar homes in the area
Home Values in the Area
Average Home Value in this Area
Purchase History
| Date | Buyer | Sale Price | Title Company |
|---|---|---|---|
| Vaisvil Brendan | $438,500 | Pioneer Title | |
| Lebaron Robin E | -- | Pioneer Title | |
| Lebaron Robin E | -- | None Available | |
| Lebaron Ronald | -- | None Available | |
| Johnson Robin E | $144,000 | Capital Title Agency Inc | |
| Lauritzen Richard J | -- | -- | |
| Lauritzen Richard J | $97,000 | First American Title |
Source: Public Records
Mortgage History
| Date | Status | Borrower | Loan Amount |
|---|---|---|---|
| Open | Vaisvil Brendan | $430,557 | |
| Previous Owner | Johnson Robin E | $112,000 | |
| Previous Owner | Lauritzen Richard J | $92,150 |
Source: Public Records
Tax History
| Year | Tax Paid | Tax Assessment Tax Assessment Total Assessment is a certain percentage of the fair market value that is determined by local assessors to be the total taxable value of land and additions on the property. | Land | Improvement |
|---|---|---|---|---|
| 2025 | $1,453 | $16,086 | -- | -- |
| 2024 | $1,350 | $15,320 | -- | -- |
| 2023 | $1,350 | $29,150 | $5,830 | $23,320 |
| 2022 | $1,321 | $22,220 | $4,440 | $17,780 |
| 2021 | $1,578 | $21,080 | $4,210 | $16,870 |
| 2020 | $1,772 | $19,530 | $3,900 | $15,630 |
| 2019 | $1,240 | $16,320 | $3,260 | $13,060 |
| 2018 | $1,184 | $14,530 | $2,900 | $11,630 |
| 2017 | $1,147 | $13,960 | $2,790 | $11,170 |
| 2016 | $1,126 | $13,070 | $2,610 | $10,460 |
| 2015 | $1,063 | $12,130 | $2,420 | $9,710 |
Source: Public Records
Map
Nearby Homes
- 1146 E Jensen St
- 1324 E Hale St
- 1550 N Stapley Dr Unit 15
- 1550 N Stapley Dr Unit 48
- 1335 E June St Unit 239
- 1335 E June St Unit 202
- 1335 E June St Unit 114
- 1304 E Hackamore St
- 1737 N Fraser Dr
- 1365 N Diane Cir
- 1837 N Daley
- 1232 E Granada St
- 1116 E Hackamore St
- 1203 E Kramer Cir
- 1920 N Consolidated Canal
- 1924 N Harris Dr
- 928 E Hope St Unit 1E
- 2020 N Hunt Cir
- 1247 E Kenwood St
- 1204 E Glencove Cir
- 1259 E Indigo St
- 1241 E Indigo St
- 1654 N Jones Cir
- 1265 E Indigo St
- 1254 E Indigo St
- 1248 E Indigo St
- 1652 N Jones Cir
- 1260 E Indigo St
- 1663 N Allen
- 1240 E Indigo St
- 1653 N Jones Cir Unit 1
- 1302 E Indigo St
- 1305 E Indigo St
- 1657 N Allen
- 1646 N Jones Cir
- 1706 N Allen
- 1306 E Indigo St
- 1263 E Ivyglen St
- 1255 E Ivyglen St
- 1247 E Ivyglen St
Your Personal Tour Guide
Ask me questions while you tour the home.