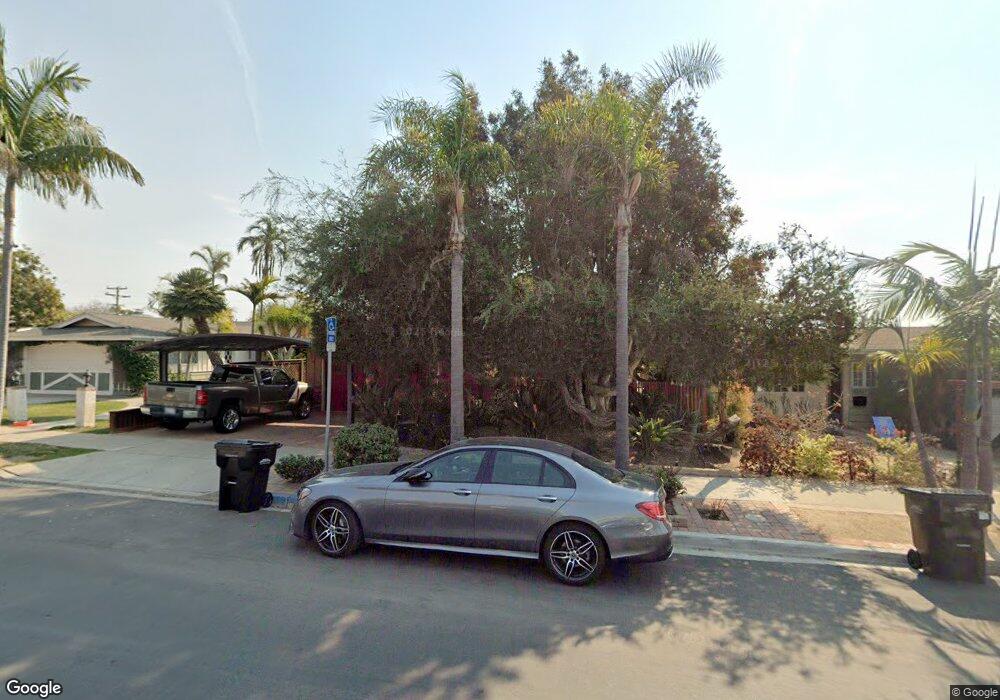
1253 Opal St San Diego, CA 92109
Pacific Beach NeighborhoodEstimated Value: $2,300,974 - $2,561,000
5
Beds
3
Baths
2,742
Sq Ft
$881/Sq Ft
Est. Value
About This Home
This home is located at 1253 Opal St, San Diego, CA 92109 and is currently estimated at $2,416,494, approximately $881 per square foot. 1253 Opal St is a home located in San Diego County with nearby schools including Pacific Beach Elementary School, Pacific Beach Middle, and Mission Bay High School.
Ownership History
Date
Name
Owned For
Owner Type
Purchase Details
Closed on
May 20, 2015
Sold by
Krokee James O and Krokee Anna I
Bought by
Krokee Ii James O
Current Estimated Value
Home Financials for this Owner
Home Financials are based on the most recent Mortgage that was taken out on this home.
Original Mortgage
$249,000
Outstanding Balance
$192,097
Interest Rate
3.64%
Mortgage Type
Credit Line Revolving
Estimated Equity
$2,224,397
Purchase Details
Closed on
Aug 18, 2011
Sold by
Krokee Anna I
Bought by
Krokee Ii James O and Tue James O Krokee Ii Trust
Purchase Details
Closed on
Dec 5, 2001
Sold by
Krokee James O
Bought by
Krokee Ii James O
Purchase Details
Closed on
Nov 24, 2000
Sold by
Krokee James O and Krokee Anna I
Bought by
Krokee Ii James O
Purchase Details
Closed on
Sep 8, 1997
Sold by
Krokee Harriet L
Bought by
Krokee Ii James O
Purchase Details
Closed on
Sep 12, 1984
Create a Home Valuation Report for This Property
The Home Valuation Report is an in-depth analysis detailing your home's value as well as a comparison with similar homes in the area
Home Values in the Area
Average Home Value in this Area
Purchase History
| Date | Buyer | Sale Price | Title Company |
|---|---|---|---|
| Krokee Ii James O | -- | Chicago Title | |
| Krokee Ii James O | -- | Chicago Title | |
| Krokee Ii James O | -- | None Available | |
| Krokee Ii James O | -- | None Available | |
| Krokee Ii James O | -- | First American Title Ins Co | |
| Krokee Ii James O | -- | -- | |
| -- | $158,000 | -- |
Source: Public Records
Mortgage History
| Date | Status | Borrower | Loan Amount |
|---|---|---|---|
| Open | Krokee Ii James O | $249,000 | |
| Closed | Krokee Ii James O | $340,000 |
Source: Public Records
Tax History Compared to Growth
Tax History
| Year | Tax Paid | Tax Assessment Tax Assessment Total Assessment is a certain percentage of the fair market value that is determined by local assessors to be the total taxable value of land and additions on the property. | Land | Improvement |
|---|---|---|---|---|
| 2025 | $3,994 | $502,009 | $227,801 | $274,208 |
| 2024 | $3,994 | $492,167 | $223,335 | $268,832 |
| 2023 | $3,971 | $482,517 | $218,956 | $263,561 |
| 2022 | $3,962 | $473,057 | $214,663 | $258,394 |
| 2021 | $3,930 | $463,782 | $210,454 | $253,328 |
| 2020 | $3,916 | $459,028 | $208,297 | $250,731 |
| 2019 | $3,859 | $450,028 | $204,213 | $245,815 |
| 2018 | $3,633 | $441,205 | $200,209 | $240,996 |
| 2017 | $3,561 | $432,555 | $196,284 | $236,271 |
| 2016 | $3,512 | $424,075 | $192,436 | $231,639 |
| 2015 | $3,451 | $417,706 | $189,546 | $228,160 |
| 2014 | -- | $409,525 | $185,834 | $223,691 |
Source: Public Records
Map
Nearby Homes
- 1154 Sapphire St
- 5209 Foothill Blvd
- 1148 Turquoise St
- 1025 Wilbur Ave
- 1505 Loring St
- 1059 Agate St Unit A
- 4944 Cass St Unit 604
- 4944 Cass St Unit 407
- 938 Opal St
- 972 Sapphire St Unit LA1
- 974 Sapphire St Unit LA2
- 976 Sapphire St Unit LA3
- 1045 Van Nuys St
- 1270 Emerald St
- 1220 Emerald St
- 1712 Beryl St
- 1326 Caminito Arriata
- 5108 Gordon Ln
- 1329 Caminito Balada
- 4733 Ingraham St