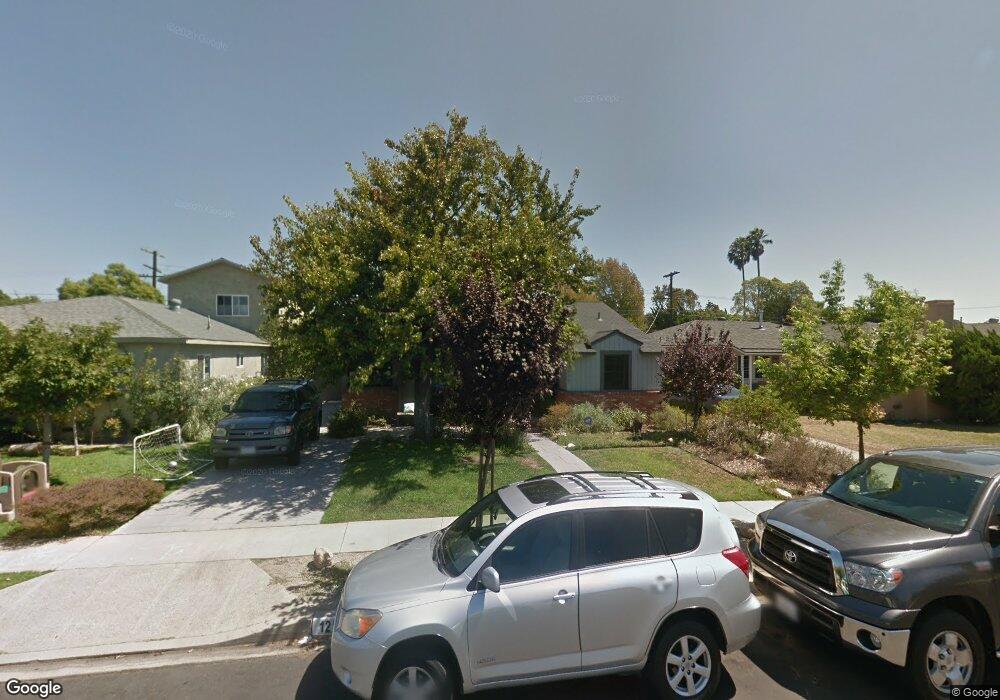
12536 Appleton Way Los Angeles, CA 90066
Mar Vista NeighborhoodEstimated Value: $1,602,000 - $2,155,000
2
Beds
1
Bath
1,168
Sq Ft
$1,554/Sq Ft
Est. Value
About This Home
This home is located at 12536 Appleton Way, Los Angeles, CA 90066 and is currently estimated at $1,814,814, approximately $1,553 per square foot. 12536 Appleton Way is a home located in Los Angeles County with nearby schools including Walgrove Avenue Elementary, Mark Twain Middle School, and Venice High School.
Ownership History
Date
Name
Owned For
Owner Type
Purchase Details
Closed on
Jan 11, 2017
Sold by
Glover Andrew S
Bought by
The Andrew S Glover & Karen Glover Famil
Current Estimated Value
Purchase Details
Closed on
Mar 14, 2015
Sold by
Glover Andrew S
Bought by
Glover Andrew S and Glover Karen
Home Financials for this Owner
Home Financials are based on the most recent Mortgage that was taken out on this home.
Original Mortgage
$478,800
Outstanding Balance
$365,093
Interest Rate
3.64%
Mortgage Type
New Conventional
Estimated Equity
$1,449,721
Purchase Details
Closed on
May 8, 2014
Sold by
Glover Andrew
Bought by
The Andrews S Glover & Karen Glover Fami
Purchase Details
Closed on
Feb 3, 2001
Sold by
Trust Shield Phyllis E Tr Phyllis E Shie
Bought by
Glover Andrew
Home Financials for this Owner
Home Financials are based on the most recent Mortgage that was taken out on this home.
Original Mortgage
$320,000
Interest Rate
6.98%
Mortgage Type
Seller Take Back
Create a Home Valuation Report for This Property
The Home Valuation Report is an in-depth analysis detailing your home's value as well as a comparison with similar homes in the area
Home Values in the Area
Average Home Value in this Area
Purchase History
| Date | Buyer | Sale Price | Title Company |
|---|---|---|---|
| The Andrew S Glover & Karen Glover Famil | -- | None Available | |
| Glover Andrew S | -- | Old Republic Title Company | |
| The Andrews S Glover & Karen Glover Fami | -- | None Available | |
| Glover Andrew | $345,000 | Old Republic Title Company |
Source: Public Records
Mortgage History
| Date | Status | Borrower | Loan Amount |
|---|---|---|---|
| Open | Glover Andrew S | $478,800 | |
| Previous Owner | Glover Andrew | $320,000 |
Source: Public Records
Tax History Compared to Growth
Tax History
| Year | Tax Paid | Tax Assessment Tax Assessment Total Assessment is a certain percentage of the fair market value that is determined by local assessors to be the total taxable value of land and additions on the property. | Land | Improvement |
|---|---|---|---|---|
| 2025 | $6,336 | $519,842 | $415,882 | $103,960 |
| 2024 | $6,233 | $509,650 | $407,728 | $101,922 |
| 2023 | $6,115 | $499,658 | $399,734 | $99,924 |
| 2022 | $5,834 | $489,862 | $391,897 | $97,965 |
| 2021 | $5,756 | $480,258 | $384,213 | $96,045 |
| 2020 | $5,813 | $475,335 | $380,274 | $95,061 |
| 2019 | $5,583 | $466,016 | $372,818 | $93,198 |
| 2018 | $5,527 | $456,879 | $365,508 | $91,371 |
| 2016 | $5,280 | $439,140 | $351,316 | $87,824 |
| 2015 | $5,202 | $432,544 | $346,039 | $86,505 |
| 2014 | -- | $424,072 | $339,261 | $84,811 |
Source: Public Records
Map
Nearby Homes
- 12566 Preston Way
- 3460 S Centinela Ave Unit 505
- 12413 Westminster Ave
- 3402 S Centinela Ave
- 3379 Stewart Ave
- 3470 Grand View Blvd
- 3524 Grand View Blvd
- 3617 Ocean View Ave
- 0 Wade St
- 11931 Lawler St
- 3711 May St
- 3750 Boise Ave
- 3362 Rosewood Ave
- 3613 Inglewood Blvd
- 12317 Navy St
- 11957 Modjeska Place
- 3757 May St
- 12118 Navy St
- 3629 Rosewood Ave
- 3723 Inglewood Blvd
- 12530 Appleton Way
- 12542 Appleton Way
- 12524 Appleton Way
- 12548 Appleton Way
- 12537 Preston Way
- 12531 Preston Way
- 12543 Preston Way
- 12518 Appleton Way
- 12554 Appleton Way
- 12525 Preston Way
- 12549 Preston Way
- 12537 Appleton Way
- 12531 Appleton Way
- 12543 Appleton Way
- 12519 Preston Way
- 12525 Appleton Way
- 12549 Appleton Way
- 12560 Appleton Way
- 12512 Appleton Way
- 12546 Preston Way