1254 Cravens Ln Unit 2 Carpinteria, CA 93013
Santa Monica-El Carro NeighborhoodEstimated Value: $1,227,000 - $2,660,000
About This Home
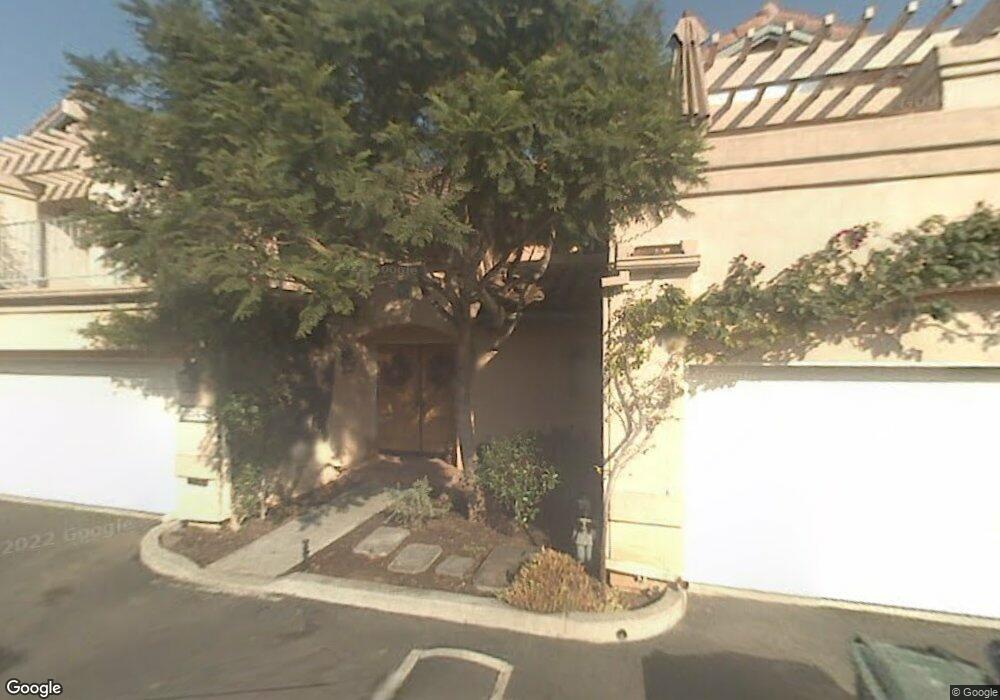
This home is located at 1254 Cravens Ln Unit 2, Carpinteria, CA 93013 and is currently estimated at $1,737,958, approximately $955 per square foot. 1254 Cravens Ln Unit 2 is a home located in Santa Barbara County with nearby schools including Carpinteria Senior High School and The Howard School.
Ownership History
We collect this data history from publicly available records. To have your information removed, we recommend requesting removal directly through your county’s website.
Purchase Details
Purchase Details
Home Financials for this Owner
Home Financials are based on the most recent Mortgage that was taken out on this home.Purchase Details
Home Financials for this Owner
Home Financials are based on the most recent Mortgage that was taken out on this home.Purchase Details
Home Values in the Area
Average Home Value in this Area
Purchase History
We collect this data history from publicly available records. To have your information removed, we recommend requesting removal directly through your county’s website.
| Date | Buyer | Sale Price | Title Company |
|---|---|---|---|
| -- | None Listed On Document | ||
| -- | First American Title Company | ||
| -- | Chicago Title Co | ||
| -- | -- |
Mortgage History
We collect this data history from publicly available records. To have your information removed, we recommend requesting removal directly through your county’s website.
| Date | Status | Borrower | Loan Amount |
|---|---|---|---|
| Previous Owner | $406,000 | ||
| Previous Owner | $500,000 |
Tax History
We collect this data history from publicly available records. To have your information removed, we recommend requesting removal directly through your county’s website.
| Year | Tax Paid | Tax Assessment Tax Assessment Total Assessment is a certain percentage of the fair market value that is determined by local assessors to be the total taxable value of land and additions on the property. | Land | Improvement |
|---|---|---|---|---|
| 2025 | $8,568 | $753,402 | $376,701 | $376,701 |
| 2023 | $8,568 | $724,148 | $362,074 | $362,074 |
| 2022 | $8,239 | $709,950 | $354,975 | $354,975 |
| 2021 | $8,056 | $696,030 | $348,015 | $348,015 |
| 2020 | $7,955 | $688,894 | $344,447 | $344,447 |
| 2019 | $7,785 | $675,388 | $337,694 | $337,694 |
| 2018 | $7,646 | $662,146 | $331,073 | $331,073 |
| 2017 | $7,500 | $649,164 | $324,582 | $324,582 |
| 2016 | $7,369 | $636,436 | $318,218 | $318,218 |
| 2014 | $6,868 | $614,600 | $307,300 | $307,300 |
Map
- 3950 Via Real Unit Spc 239
- 3735 Santa Claus Ln
- 571 Sand Point Rd
- 910 Pear St
- 4501 Carpinteria Ave Unit C
- 1915 Monte Alegre
- 01 Monte Alegre Dr
- 3595 Padaro Ln
- 3581 Padaro Ln
- 4655 El Carro Ln
- 4631 Carpinteria Ave
- 349 Ash Ave Unit Spc 17
- 349 Ash Ave Unit 45
- 160 Ash Ave
- 4677 Carpinteria Ave Unit P
- 1994 Paquita Dr
- 4768 Sterling Way
- 4725 9th St Unit 31
- 3519 Padaro Ln
- 4801 Nipomo Dr
- 1256 Cravens Ln
- 1256 Cravens Ln Unit 1256-1
- 1256 Cravens Ln Unit 3
- 1256 Cravens Ln Unit 2
- 1256 Cravens Ln Unit 1
- 1256 Cravens Ln 1
- 1256-3 Cravens Ln
- 1250-3 Cravens Ln
- 1262 Cravens Ln Unit 1
- 1262 Cravens Ln
- 1254 Cravens Ln
- 1254 Cravens Ln Unit 3
- 1254 Cravens Ln Unit 1
- 1254 Cravens Ln Unit 2
- 1252 Cravens #1 Ln Unit 1
- 1252 Cravens Ln Unit 3
- 1252 Cravens Ln Unit 2
- 1252 Cravens Ln Unit 1
- 1250-1 Cravens Ln Unit 1
- 1250-1 Cravens Ln
Ask me questions while you tour the home.