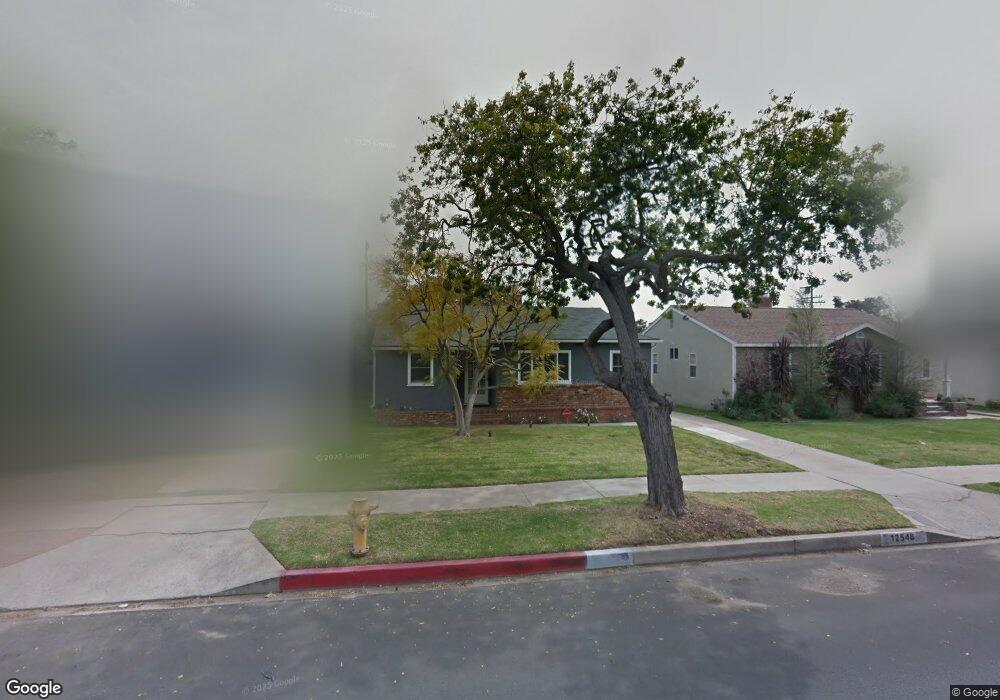
12548 Rose Ave Los Angeles, CA 90066
Mar Vista NeighborhoodEstimated Value: $2,052,000 - $2,255,000
3
Beds
2
Baths
1,706
Sq Ft
$1,268/Sq Ft
Est. Value
About This Home
This home is located at 12548 Rose Ave, Los Angeles, CA 90066 and is currently estimated at $2,163,097, approximately $1,267 per square foot. 12548 Rose Ave is a home located in Los Angeles County with nearby schools including Walgrove Avenue Elementary, Mark Twain Middle School, and Venice High School.
Ownership History
Date
Name
Owned For
Owner Type
Purchase Details
Closed on
Apr 29, 2017
Sold by
Heavner Daniel Lee
Bought by
Lee Heavner D and D Lee Heavner Separate Property Trust
Current Estimated Value
Purchase Details
Closed on
Mar 4, 2010
Sold by
Chan Hang Fai and Wong Wai Hoi Clara
Bought by
Heavner Daniel Lee
Purchase Details
Closed on
Jun 26, 2006
Sold by
Mulligan Christopher Laurence and Sennish Maggie Brady
Bought by
Chan Hang Fai
Purchase Details
Closed on
Dec 21, 2004
Sold by
Mulligan Christopher Laurence and Sennish Maggie Brady
Bought by
Mulligan Christopher Laurence
Purchase Details
Closed on
Sep 15, 2004
Sold by
Abrams Judith L
Bought by
Mulligan Christopher
Home Financials for this Owner
Home Financials are based on the most recent Mortgage that was taken out on this home.
Original Mortgage
$628,000
Interest Rate
5.77%
Mortgage Type
Purchase Money Mortgage
Create a Home Valuation Report for This Property
The Home Valuation Report is an in-depth analysis detailing your home's value as well as a comparison with similar homes in the area
Home Values in the Area
Average Home Value in this Area
Purchase History
| Date | Buyer | Sale Price | Title Company |
|---|---|---|---|
| Lee Heavner D | -- | None Available | |
| Heavner Daniel Lee | $850,000 | Lawyers Title | |
| Chan Hang Fai | $912,000 | Southland Title | |
| Mulligan Christopher Laurence | -- | -- | |
| Mulligan Christopher Laurence | -- | -- | |
| Mulligan Christopher | $785,000 | Southland Title Company |
Source: Public Records
Mortgage History
| Date | Status | Borrower | Loan Amount |
|---|---|---|---|
| Previous Owner | Mulligan Christopher | $628,000 | |
| Closed | Mulligan Christopher | $78,500 |
Source: Public Records
Tax History Compared to Growth
Tax History
| Year | Tax Paid | Tax Assessment Tax Assessment Total Assessment is a certain percentage of the fair market value that is determined by local assessors to be the total taxable value of land and additions on the property. | Land | Improvement |
|---|---|---|---|---|
| 2025 | $13,066 | $1,097,187 | $868,073 | $229,114 |
| 2024 | $13,066 | $1,075,674 | $851,052 | $224,622 |
| 2023 | $12,814 | $1,054,583 | $834,365 | $220,218 |
| 2022 | $12,217 | $1,033,905 | $818,005 | $215,900 |
| 2021 | $12,062 | $1,013,633 | $801,966 | $211,667 |
| 2019 | $11,698 | $983,570 | $778,180 | $205,390 |
| 2018 | $11,627 | $964,285 | $762,922 | $201,363 |
| 2016 | $11,115 | $926,843 | $733,298 | $193,545 |
| 2015 | $10,950 | $912,922 | $722,284 | $190,638 |
| 2014 | $10,987 | $895,040 | $708,136 | $186,904 |
Source: Public Records
Map
Nearby Homes
- 3379 Stewart Ave
- 3402 S Centinela Ave
- 12317 Navy St
- 12566 Preston Way
- 3460 S Centinela Ave Unit 505
- 12118 Navy St
- 12413 Westminster Ave
- 3470 Grand View Blvd
- 3362 Rosewood Ave
- 13023 Warren Ave
- 3524 Grand View Blvd
- 13053 Rose Ave
- 13025 Dewey St
- 11931 Lawler St
- 3134 Granville Ave
- 13137 Warren Ave
- 3617 Ocean View Ave
- 3230 S Barrington Ave
- 3218 S Barrington Ave
- 0 Wade St
- 12542 Rose Ave
- 12554 Rose Ave
- 12560 Rose Ave
- 12536 Rose Ave
- 12549 Indianapolis St
- 12543 Indianapolis St
- 12555 Indianapolis St
- 12566 Rose Ave
- 12530 Rose Ave
- 12537 Indianapolis St
- 12561 Indianapolis St
- 12541 Rose Ave
- 12547 Rose Ave
- 12537 Rose Ave
- 12531 Indianapolis St Unit HOUSE
- 12531 Indianapolis St
- 12567 Indianapolis St
- 12574 Rose Ave
- 12524 Rose Ave
- 12551 Rose Ave