Estimated payment $1,593/month
Highlights
- Granite Countertops
- 2 Car Attached Garage
- Forced Air Heating and Cooling System
- No HOA
- Shed
- Fenced
About This Home
***Seller offering to pay first 3 full month's mortgage payment for buyer.***
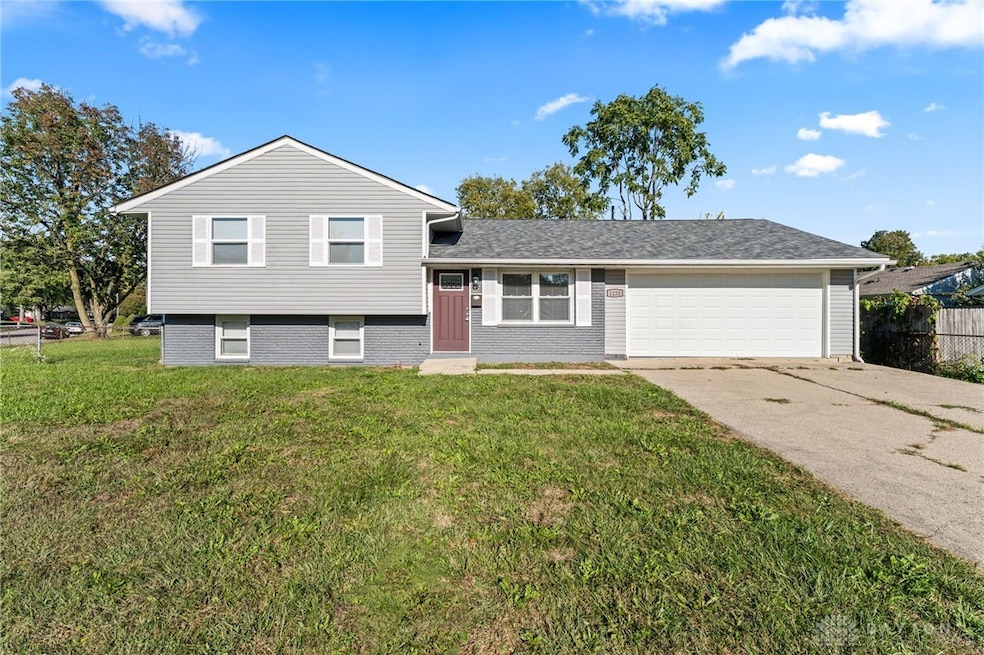
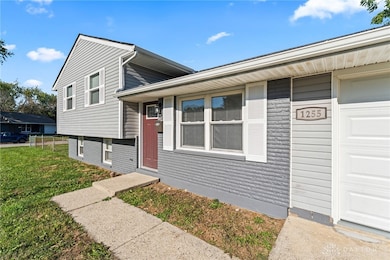
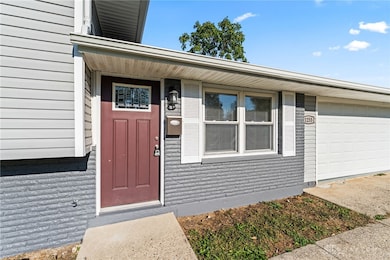
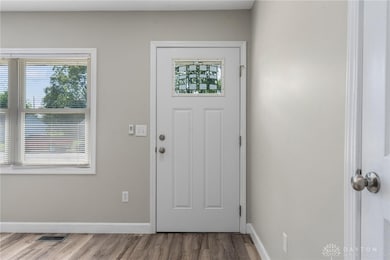
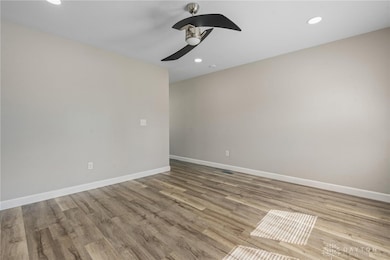
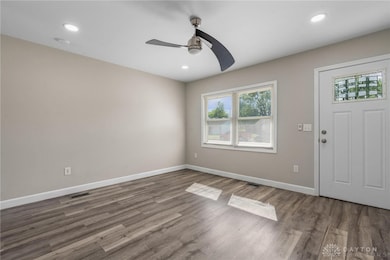
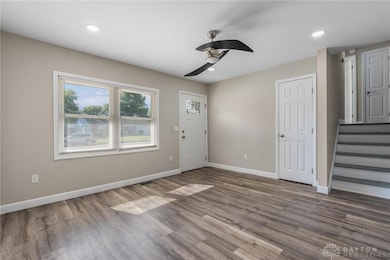
This charming 4-bedroom, 1.5-bath tri-level home has been thoughtfully remodeled from top to bottom! A full renovation in 2020 included a new roof, gutters, siding, modern flooring, updated lighting, and a clean, contemporary feel throughout. Step inside to a bright, welcoming living room with plenty of natural light. Just off the living area, the eat-in kitchen offers a functional layout with ample space for everyday dining. Downstairs, the spacious master bedroom provides privacy and convenience with its own half bath, closet, and direct access to the laundry area. Upstairs, you’ll find three additional bedrooms and a full bathroom, offering space for family, guests, or a home office setup. Step outside to a fully fenced backyard, ideal for relaxing or entertaining. A large 12x16 shed provides generous storage space and could also serve as a workshop or hobby area. The front of the home received a fresh coat of paint in 2025, adding to its well-maintained appearance. An attached two-car garage completes the home, offering additional storage and off-street parking. Don’t miss your chance to own this move-in-ready gem!
Listing Agent
Luma Realty Brokerage Phone: 937-572-2759 License #2016001291 Listed on: 10/02/2025
Home Details
Home Type
- Single Family
Est. Annual Taxes
- $2,679
Year Built
- 1970
Lot Details
- 0.28 Acre Lot
- Fenced
Parking
- 2 Car Attached Garage
Home Design
- Vinyl Siding
Interior Spaces
- 1,384 Sq Ft Home
- 3-Story Property
- Finished Basement
Kitchen
- Range
- Microwave
- Dishwasher
- Granite Countertops
Bedrooms and Bathrooms
- 4 Bedrooms
Outdoor Features
- Shed
Utilities
- Forced Air Heating and Cooling System
- Heating System Uses Natural Gas
Community Details
- No Home Owners Association
- Windsor Park Sec 04 Subdivision
Listing and Financial Details
- Assessor Parcel Number M40000100360017600
Map
Home Values in the Area
Average Home Value in this Area
Tax History
| Year | Tax Paid | Tax Assessment Tax Assessment Total Assessment is a certain percentage of the fair market value that is determined by local assessors to be the total taxable value of land and additions on the property. | Land | Improvement |
|---|---|---|---|---|
| 2024 | $2,679 | $62,610 | $12,680 | $49,930 |
| 2023 | $2,679 | $62,610 | $12,680 | $49,930 |
| 2022 | $2,246 | $44,770 | $7,460 | $37,310 |
| 2021 | $2,276 | $37,970 | $7,460 | $30,510 |
| 2020 | $1,945 | $37,970 | $7,460 | $30,510 |
| 2019 | $1,078 | $30,130 | $7,390 | $22,740 |
| 2018 | $1,082 | $30,130 | $7,390 | $22,740 |
| 2017 | $935 | $30,130 | $7,390 | $22,740 |
| 2016 | $936 | $26,900 | $7,390 | $19,510 |
| 2015 | $938 | $26,900 | $7,390 | $19,510 |
| 2014 | $898 | $26,900 | $7,390 | $19,510 |
Property History
| Date | Event | Price | List to Sale | Price per Sq Ft |
|---|---|---|---|---|
| 10/02/2025 10/02/25 | For Sale | $259,900 | -- | $188 / Sq Ft |
Purchase History
| Date | Type | Sale Price | Title Company |
|---|---|---|---|
| Limited Warranty Deed | $80,200 | None Available | |
| Sheriffs Deed | $76,247 | None Available | |
| Warranty Deed | $108,000 | -- |
Mortgage History
| Date | Status | Loan Amount | Loan Type |
|---|---|---|---|
| Previous Owner | $106,331 | FHA |
Source: Dayton REALTORS®
MLS Number: 944667
APN: M40-0001-0036-0-0176-00
Disclaimer: Certain information contained herein is derived from information provided by parties other than Homes.com. All information provided is deemed reliable, but is not guaranteed to be accurate and should be independently verified.
![]() The information is being provided by Dayton Area Board of Realtors MLS. Information deemed reliable but not guaranteed. Information is provided for the consumer's personal, non-commercial use, and may not be used for any purpose other than the identification of potential properties for purchase. Copyright 2025 Dayton Area Board of Realtors MLS. All Rights Reserved.
The information is being provided by Dayton Area Board of Realtors MLS. Information deemed reliable but not guaranteed. Information is provided for the consumer's personal, non-commercial use, and may not be used for any purpose other than the identification of potential properties for purchase. Copyright 2025 Dayton Area Board of Realtors MLS. All Rights Reserved.
- 1107 Arkansas Dr
- 1908 Whitt St
- 1866 Roxbury Dr
- 2499 Jenny Marie Dr
- 2187 Minnesota Dr
- 1829 Gayhart Dr
- 2540 Jenny Marie Dr
- 2421 Louisiana Dr
- 2265 Minnesota Dr
- 1769 Gayhart Dr
- 2540 Cornwall Dr
- 2257 Maryland Dr
- 0 Berkshire Dr Unit 942854
- 1778 Arapaho Dr
- 2142 Michigan Dr
- 1653 Seneca Dr
- 2545 Harmony Dr
- 1618 Navajo Dr
- 2692 Kingman Dr
- 2784 Greystoke Dr
- 1479 Colorado Dr
- 1255 Arkansas Dr
- 1337 Vimla Way
- 1302 Shannon Ln
- 475 Stelton Rd Unit 479
- 475 Stelton Rd Unit 475
- 1600 Deer Creek Dr
- 643 Smith Ave
- 769 Hilltop Rd
- 2436 Sherbourne Way
- 1075 Meadow Dr
- 337 Honey Jane Dr
- 2177 Bandit Trail
- 1400 Parkman Place Unit 1406
- 1130 Cymar Dr E
- 3878 Pepperwell Cir
- 599 Bellasera Dr
- 3764 Woodbrook Way
- 3724 Aftonshire Dr
- 1285 Wallaby Dr
