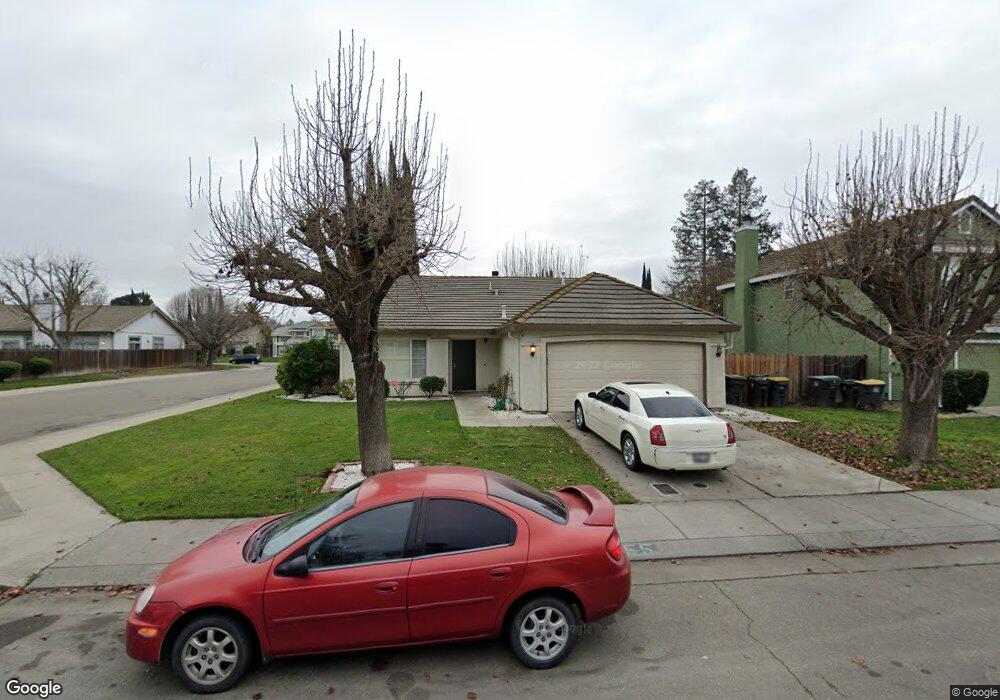
1255 Lloyd Thayer Cir Stockton, CA 95206
Weston Ranch NeighborhoodEstimated Value: $387,000 - $460,000
3
Beds
2
Baths
1,642
Sq Ft
$265/Sq Ft
Est. Value
About This Home
This home is located at 1255 Lloyd Thayer Cir, Stockton, CA 95206 and is currently estimated at $435,321, approximately $265 per square foot. 1255 Lloyd Thayer Cir is a home located in San Joaquin County with nearby schools including August Knodt Elementary School and Weston Ranch High School.
Ownership History
Date
Name
Owned For
Owner Type
Purchase Details
Closed on
Aug 11, 2022
Sold by
Coleman Alfreo
Bought by
Coleman Living Trust
Current Estimated Value
Purchase Details
Closed on
Nov 14, 2012
Sold by
Omgen Ii Llc
Bought by
Coleman Alfred
Home Financials for this Owner
Home Financials are based on the most recent Mortgage that was taken out on this home.
Original Mortgage
$96,000
Interest Rate
3.34%
Mortgage Type
New Conventional
Purchase Details
Closed on
Mar 13, 2000
Sold by
Washington Helen
Bought by
Omgenii Llc
Purchase Details
Closed on
May 17, 1994
Sold by
Grant Homes Inc
Bought by
Washington Helen
Home Financials for this Owner
Home Financials are based on the most recent Mortgage that was taken out on this home.
Original Mortgage
$116,462
Interest Rate
8.3%
Mortgage Type
FHA
Create a Home Valuation Report for This Property
The Home Valuation Report is an in-depth analysis detailing your home's value as well as a comparison with similar homes in the area
Home Values in the Area
Average Home Value in this Area
Purchase History
| Date | Buyer | Sale Price | Title Company |
|---|---|---|---|
| Coleman Living Trust | -- | -- | |
| Coleman Alfred | $120,000 | Old Republic Title Company | |
| Omgenii Llc | $150,000 | Stewart Title | |
| Washington Helen | $118,000 | Central Valley Title Co |
Source: Public Records
Mortgage History
| Date | Status | Borrower | Loan Amount |
|---|---|---|---|
| Previous Owner | Coleman Alfred | $96,000 | |
| Previous Owner | Washington Helen | $116,462 |
Source: Public Records
Tax History Compared to Growth
Tax History
| Year | Tax Paid | Tax Assessment Tax Assessment Total Assessment is a certain percentage of the fair market value that is determined by local assessors to be the total taxable value of land and additions on the property. | Land | Improvement |
|---|---|---|---|---|
| 2025 | $2,611 | $147,763 | $36,939 | $110,824 |
| 2024 | $2,521 | $144,866 | $36,215 | $108,651 |
| 2023 | $2,390 | $142,026 | $35,505 | $106,521 |
| 2022 | $2,330 | $139,242 | $34,809 | $104,433 |
| 2021 | $2,280 | $136,513 | $34,127 | $102,386 |
| 2020 | $2,199 | $135,115 | $33,778 | $101,337 |
| 2019 | $2,162 | $132,466 | $33,116 | $99,350 |
| 2018 | $2,150 | $129,869 | $32,467 | $97,402 |
| 2017 | $2,111 | $127,324 | $31,831 | $95,493 |
| 2016 | $2,023 | $124,828 | $31,207 | $93,621 |
| 2014 | $2,087 | $120,545 | $30,136 | $90,409 |
Source: Public Records
Map
Nearby Homes
- 3412 Shogoro Ln
- 1117 Glenmohr Ct
- 971 Kate Linde Cir
- 1890 Gordon Verner Cir
- 627 Queensland Cir
- 1141 Klemeyer Cir
- 1131 Klemeyer Cir
- 921 Kate Linde Cir
- 2079 Gordon Verner Cir
- 703 Villanueva Ct
- 3779 Zeally Ln
- 1842 William Moss Blvd
- 4116 Vercelli St
- 3812 Steve Lillie Cir
- 4144 Blake Cir
- 2507 Colorado Ave
- 4135 Roma Ln
- 3745 Wild Rose Ln
- 4303 Giselle Ln
- 2650 S Fresno Ave
- 1251 Lloyd Thayer Cir
- 3315 Buttrick Ln
- 1247 Lloyd Thayer Cir
- 1259 Lloyd Thayer Cir
- 1254 Lloyd Thayer Cir
- 3293 Buttrick Ln
- 3339 Buttrick Ln
- 1250 Lloyd Thayer Cir
- 1243 Lloyd Thayer Cir
- 1258 Lloyd Thayer Cir
- 1263 Lloyd Thayer Cir
- 1246 Lloyd Thayer Cir
- 3277 Buttrick Ln
- 3351 Buttrick Ln
- 1206 Mine St
- 1239 Lloyd Thayer Cir
- 1242 Lloyd Thayer Cir
- 1267 Lloyd Thayer Cir
- 3308 Buttrick Ln
- 1230 Mine St