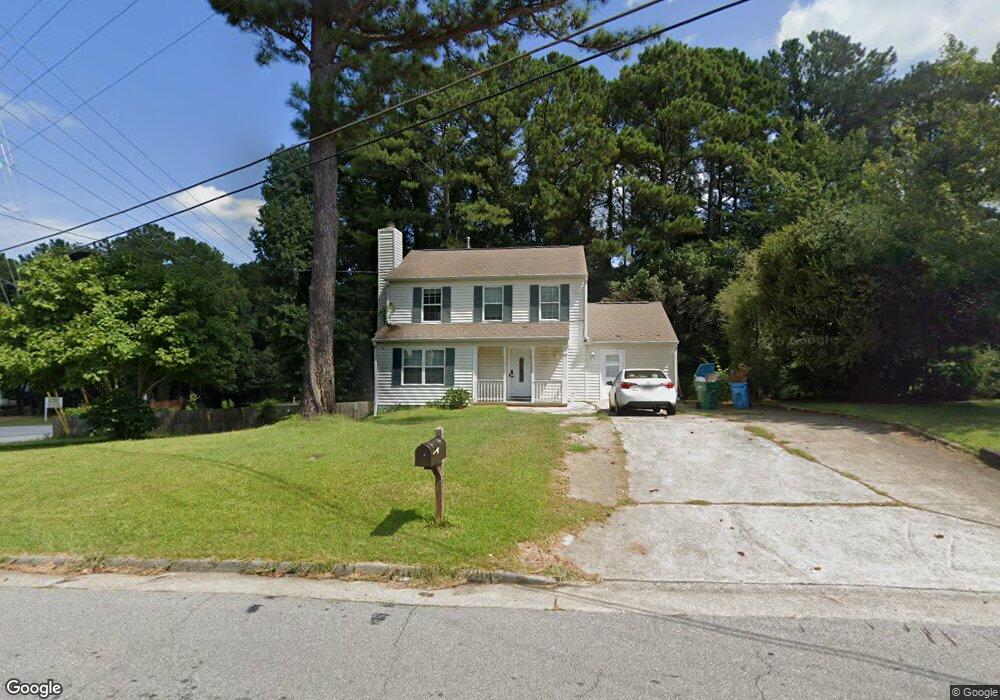
1255 Riva Ridge Dr NW Unit 1/1 Norcross, GA 30093
Estimated Value: $330,351 - $377,000
3
Beds
4
Baths
1,804
Sq Ft
$200/Sq Ft
Est. Value
About This Home
This home is located at 1255 Riva Ridge Dr NW Unit 1/1, Norcross, GA 30093 and is currently estimated at $360,088, approximately $199 per square foot. 1255 Riva Ridge Dr NW Unit 1/1 is a home located in Gwinnett County with nearby schools including Lilburn Elementary School, Lilburn Middle School, and Meadowcreek High School.
Ownership History
Date
Name
Owned For
Owner Type
Purchase Details
Closed on
Aug 26, 2019
Sold by
Mam Johnny C
Bought by
Diaz Andy
Current Estimated Value
Home Financials for this Owner
Home Financials are based on the most recent Mortgage that was taken out on this home.
Original Mortgage
$204,517
Outstanding Balance
$178,730
Interest Rate
3.7%
Mortgage Type
New Conventional
Estimated Equity
$181,358
Purchase Details
Closed on
Apr 14, 2009
Sold by
First Boston Mbs Heat 2003-8
Bought by
Mann Johnny C and Lim Danne
Purchase Details
Closed on
Feb 3, 2009
Sold by
Visi Leonardo A
Bought by
First Boston Mbs Heat 2003-8
Purchase Details
Closed on
Nov 4, 2003
Sold by
Sharifi Sayed and Sharifi Suraya A
Bought by
Visi Leonardo
Home Financials for this Owner
Home Financials are based on the most recent Mortgage that was taken out on this home.
Original Mortgage
$116,000
Interest Rate
6%
Mortgage Type
New Conventional
Create a Home Valuation Report for This Property
The Home Valuation Report is an in-depth analysis detailing your home's value as well as a comparison with similar homes in the area
Home Values in the Area
Average Home Value in this Area
Purchase History
| Date | Buyer | Sale Price | Title Company |
|---|---|---|---|
| Diaz Andy | $201,000 | -- | |
| Mann Johnny C | $62,000 | -- | |
| First Boston Mbs Heat 2003-8 | $71,200 | -- | |
| Visi Leonardo | $145,000 | -- |
Source: Public Records
Mortgage History
| Date | Status | Borrower | Loan Amount |
|---|---|---|---|
| Open | Diaz Andy | $204,517 | |
| Previous Owner | Visi Leonardo | $116,000 | |
| Previous Owner | Visi Leonardo | $29,000 |
Source: Public Records
Tax History Compared to Growth
Tax History
| Year | Tax Paid | Tax Assessment Tax Assessment Total Assessment is a certain percentage of the fair market value that is determined by local assessors to be the total taxable value of land and additions on the property. | Land | Improvement |
|---|---|---|---|---|
| 2025 | $3,804 | $130,520 | $21,120 | $109,400 |
| 2024 | $3,777 | $123,200 | $21,120 | $102,080 |
| 2023 | $3,777 | $114,080 | $20,000 | $94,080 |
| 2022 | $3,337 | $103,720 | $14,000 | $89,720 |
| 2021 | $2,747 | $73,760 | $14,000 | $59,760 |
| 2020 | $2,985 | $73,760 | $14,000 | $59,760 |
| 2019 | $2,402 | $60,160 | $11,600 | $48,560 |
| 2018 | $2,400 | $60,160 | $11,600 | $48,560 |
| 2016 | $1,829 | $43,360 | $9,200 | $34,160 |
| 2015 | $1,445 | $32,040 | $6,000 | $26,040 |
| 2014 | -- | $32,040 | $6,000 | $26,040 |
Source: Public Records
Map
Nearby Homes
- 5345 Seattle Slew Ct Unit 3
- 5333 Bishops Cir
- 5271 Williams Rd Unit A-1
- 1133 Sandune Dr
- 5181 Cold Springs Dr NW
- 1413 Silver Lake Dr
- 5323 Sherwin Dr
- 5331 Sherwin Dr
- 5431 Village Green Square Unit 1018
- 5148 Whited Way NW Unit 1
- 5343 Sherwin Dr Unit 15
- 5425 Village Green Square Unit 3
- 1066 Worcester Place NW Unit 4
- 1013 Sandune Dr
- 1461 Silver Lake Dr
- 5554 Clover Rise Ln Unit 2
- 5341 Woodbin Dr
- 1437 Roman Point Dr
- 897 Six Oaks Cir Unit B
- 936 Six Oaks Cir Unit B
- 1255 Riva Ridge Dr Unit 1/1
- 1255 Riva Ridge Dr
- 1249 Riva Ridge Dr NW
- 1243 Riva Ridge Dr Unit I
- 1256 Riva Ridge Dr
- 1250 Riva Ridge Dr Unit 1
- 1244 Riva Ridge Dr Unit 1
- 1262 Hydaburg Ln
- 1237 Riva Ridge Dr Unit 1
- 1273 Hydaburg Ln
- 1238 Riva Ridge Dr
- 1238 Riva Ridge Dr NW
- 1277 Seattle Slew Ln Unit 3
- 1269 Seattle Slew Ln Unit 3
- 1231 Riva Ridge Dr Unit 1
- 1272 Hydaburg Ln
- 1253 Seattle Slew Ln
- 5145 Downs Way Unit 1
- 1253 Seattle Slew Ln NW
- 1232 Riva Ridge Dr