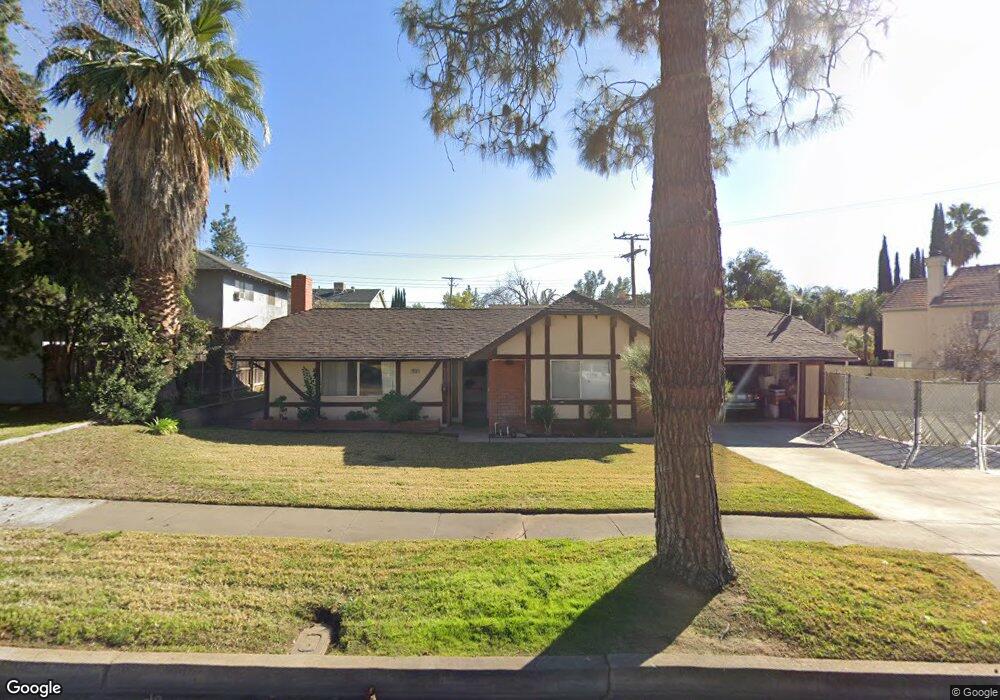
1256 Morrison Dr Redlands, CA 92374
South Redlands NeighborhoodEstimated Value: $590,283 - $660,000
4
Beds
2
Baths
1,755
Sq Ft
$358/Sq Ft
Est. Value
About This Home
This home is located at 1256 Morrison Dr, Redlands, CA 92374 and is currently estimated at $628,321, approximately $358 per square foot. 1256 Morrison Dr is a home located in San Bernardino County with nearby schools including Kingsbury Elementary School, Moore Middle School, and Redlands East Valley High School.
Ownership History
Date
Name
Owned For
Owner Type
Purchase Details
Closed on
Jul 25, 2012
Sold by
Dirige Filomena
Bought by
Dirige Filomena Baquiran and The Filomena Baquiran Dirge Fa
Current Estimated Value
Purchase Details
Closed on
Jun 6, 2012
Sold by
Belkind Cirila Baquiran
Bought by
Belkind Cirila Baquiran and The Cirila Baquiran Belkind Li
Purchase Details
Closed on
Jan 13, 1995
Sold by
Baquiran Cirila
Bought by
Baquiran Cirila and Dirige Romeo
Create a Home Valuation Report for This Property
The Home Valuation Report is an in-depth analysis detailing your home's value as well as a comparison with similar homes in the area
Home Values in the Area
Average Home Value in this Area
Purchase History
| Date | Buyer | Sale Price | Title Company |
|---|---|---|---|
| Dirige Filomena Baquiran | -- | None Available | |
| Belkind Cirila Baquiran | -- | None Available | |
| Belkind Cirila Baquiran | -- | None Available | |
| Dirige Filomena Baquiran | -- | None Available | |
| Baquiran Cirila | -- | -- |
Source: Public Records
Tax History
| Year | Tax Paid | Tax Assessment Tax Assessment Total Assessment is a certain percentage of the fair market value that is determined by local assessors to be the total taxable value of land and additions on the property. | Land | Improvement |
|---|---|---|---|---|
| 2025 | $3,092 | $246,810 | $77,900 | $168,910 |
| 2024 | $2,888 | $241,971 | $76,373 | $165,598 |
| 2023 | $2,885 | $237,226 | $74,875 | $162,351 |
| 2022 | $2,843 | $232,575 | $73,407 | $159,168 |
| 2021 | $2,895 | $228,015 | $71,968 | $156,047 |
| 2020 | $2,852 | $225,677 | $71,230 | $154,447 |
| 2019 | $2,773 | $221,252 | $69,833 | $151,419 |
| 2018 | $2,618 | $216,914 | $68,464 | $148,450 |
| 2017 | $2,595 | $212,661 | $67,122 | $145,539 |
| 2016 | $2,564 | $208,491 | $65,806 | $142,685 |
| 2015 | $2,544 | $205,360 | $64,818 | $140,542 |
| 2014 | $2,497 | $201,337 | $63,548 | $137,789 |
Source: Public Records
Map
Nearby Homes
- 1032 Ardmore Cir
- 1089 Ardmore Cir
- 217 Judson St
- 1049 Evergreen Ct
- 15 Naomi St
- 455 Judson St Unit 9
- 506 Lytle St
- 1427 Laramie Ave
- 450 Judson St Unit 94
- 1200 E Highland Ave Unit 207
- 1479 Moore St
- 1442 Moore St
- 1452 Moore St
- 1458 Moore St
- 1476 Moore St
- 635 E Palm Ave
- 1528 Laramie Ave
- 61 Sparrow Ct
- 1410 Pleasantview Dr
- 56 Dearborn Cir
- 1248 Morrison Dr
- 1244 Morrison Dr
- 700 S Grove St
- 721 Napa Ave
- 1253 Morrison Dr
- 1240 Morrison Dr
- 1257 Morrison Dr
- 719 Napa Ave
- 1245 Morrison Dr
- 1261 Morrison Dr
- 1241 Morrison Dr
- 1237 Morrison Dr
- 1244 E Cypress Ave
- 1252 E Citrus Ave
- 1152 E Cypress Ave
- 1256 E Citrus Ave
- 1248 E Citrus Ave
- 1302 Morrison Dr
- 720 Napa Ave
- 705 S Grove St
Your Personal Tour Guide
Ask me questions while you tour the home.