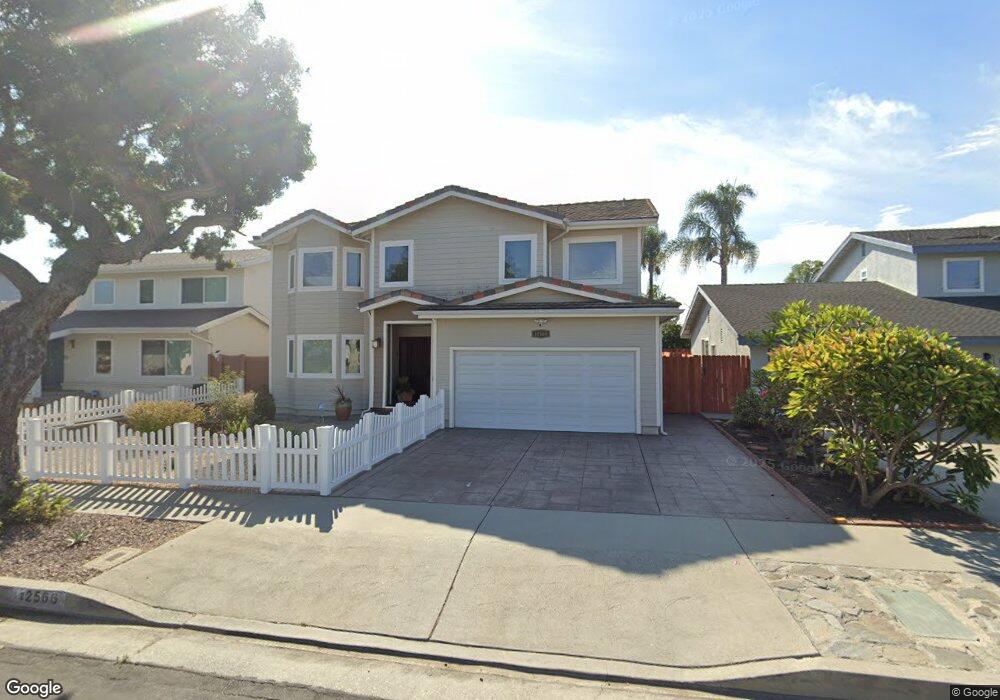
12566 Havelock Ave Los Angeles, CA 90066
Del Rey NeighborhoodEstimated Value: $1,631,000 - $2,119,831
4
Beds
5
Baths
2,814
Sq Ft
$694/Sq Ft
Est. Value
About This Home
This home is located at 12566 Havelock Ave, Los Angeles, CA 90066 and is currently estimated at $1,953,708, approximately $694 per square foot. 12566 Havelock Ave is a home located in Los Angeles County with nearby schools including Braddock Drive Elementary School, Marina Del Rey Middle School, and Venice High School.
Ownership History
Date
Name
Owned For
Owner Type
Purchase Details
Closed on
Aug 29, 2003
Sold by
Abraham Joseph and Abraham Renata N
Bought by
Abraham Joseph
Current Estimated Value
Purchase Details
Closed on
Dec 21, 2001
Sold by
Abraham Joseph and Nekovarova Renata
Bought by
Abraham Joseph
Home Financials for this Owner
Home Financials are based on the most recent Mortgage that was taken out on this home.
Original Mortgage
$272,000
Interest Rate
6.51%
Purchase Details
Closed on
Jan 2, 1997
Sold by
Commercial Federal Mtg Corp
Bought by
Abraham Joseph
Home Financials for this Owner
Home Financials are based on the most recent Mortgage that was taken out on this home.
Original Mortgage
$248,400
Interest Rate
8.25%
Purchase Details
Closed on
Sep 4, 1996
Sold by
Kim Young Shik and Kim Young Ok
Bought by
Commercial Federal Mtg Corp and Railroad Svgs Bank
Create a Home Valuation Report for This Property
The Home Valuation Report is an in-depth analysis detailing your home's value as well as a comparison with similar homes in the area
Home Values in the Area
Average Home Value in this Area
Purchase History
| Date | Buyer | Sale Price | Title Company |
|---|---|---|---|
| Abraham Joseph | -- | -- | |
| Abraham Joseph | -- | Investors Title Company | |
| Abraham Joseph | $276,000 | Guardian Title | |
| Commercial Federal Mtg Corp | $260,400 | First Southwestern Title |
Source: Public Records
Mortgage History
| Date | Status | Borrower | Loan Amount |
|---|---|---|---|
| Closed | Abraham Joseph | $272,000 | |
| Closed | Abraham Joseph | $248,400 |
Source: Public Records
Tax History Compared to Growth
Tax History
| Year | Tax Paid | Tax Assessment Tax Assessment Total Assessment is a certain percentage of the fair market value that is determined by local assessors to be the total taxable value of land and additions on the property. | Land | Improvement |
|---|---|---|---|---|
| 2025 | $8,023 | $655,536 | $247,224 | $408,312 |
| 2024 | $8,023 | $642,683 | $242,377 | $400,306 |
| 2023 | $7,873 | $630,082 | $237,625 | $392,457 |
| 2022 | $7,516 | $617,728 | $232,966 | $384,762 |
| 2021 | $7,418 | $605,617 | $228,399 | $377,218 |
| 2019 | $7,198 | $587,657 | $221,626 | $366,031 |
| 2018 | $7,121 | $576,135 | $217,281 | $358,854 |
| 2016 | $6,789 | $553,765 | $208,845 | $344,920 |
| 2015 | $6,690 | $545,447 | $205,708 | $339,739 |
| 2014 | $6,717 | $534,763 | $201,679 | $333,084 |
Source: Public Records
Map
Nearby Homes
- 12531 Culver Blvd
- 12537 Rubens Ave
- 4912 S Centinela Ave
- 4852 S Centinela Ave
- 4962 S Centinela Ave
- 4964 S Centinela Ave
- 4978 S Centinela Ave
- 12871 Rubens Ave
- 12479 Walsh Ave
- 5000 S Centinela Ave Unit 109
- 5000 S Centinela Ave Unit 336
- 5000 S Centinela Ave Unit 128
- 5000 S Centinela Ave Unit 244
- 12445 Greene Ave
- 12520 Gilmore Ave
- 12961 Panama St
- 12926 Bonaparte Ave
- 12870 Walsh Ave
- 4632 Marshall Dr
- 12417 Aneta St
- 12572 Havelock Ave
- 12560 Havelock Ave
- 12563 Presnell St
- 12557 Presnell St
- 12554 Havelock Ave
- 12576 Havelock Ave
- 12569 Presnell St
- 12551 Presnell St
- 12565 Havelock Ave
- 12571 Havelock Ave
- 12559 Havelock Ave
- 12580 Havelock Ave
- 12548 Havelock Ave
- 12571 Presnell St
- 12545 Presnell St
- 12575 Havelock Ave
- 12553 Havelock Ave
- 12581 Havelock Ave
- 12542 Havelock Ave
- 12570 Presnell St