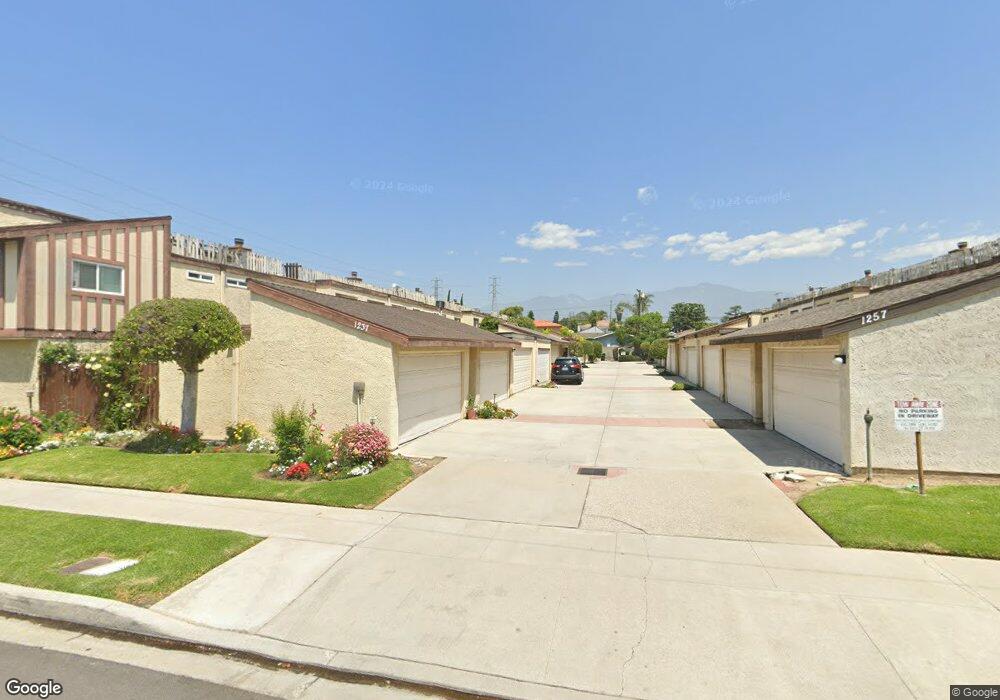
1257 Elm Ave Unit C San Gabriel, CA 91775
Estimated Value: $536,035 - $710,000
2
Beds
2
Baths
946
Sq Ft
$659/Sq Ft
Est. Value
About This Home
This home is located at 1257 Elm Ave Unit C, San Gabriel, CA 91775 and is currently estimated at $623,759, approximately $659 per square foot. 1257 Elm Ave Unit C is a home located in Los Angeles County with nearby schools including Wilson Elementary School, Jefferson Middle School, and Gabrielino High School.
Ownership History
Date
Name
Owned For
Owner Type
Purchase Details
Closed on
Oct 4, 2002
Sold by
Wu Nancy
Bought by
Wang Hong Liang and Zhang Aiwu
Current Estimated Value
Home Financials for this Owner
Home Financials are based on the most recent Mortgage that was taken out on this home.
Original Mortgage
$141,000
Outstanding Balance
$59,156
Interest Rate
6.17%
Estimated Equity
$564,603
Purchase Details
Closed on
Sep 11, 2001
Sold by
Huang Shiu Yen
Bought by
Wu Nancy
Home Financials for this Owner
Home Financials are based on the most recent Mortgage that was taken out on this home.
Original Mortgage
$124,000
Interest Rate
6.91%
Purchase Details
Closed on
May 19, 1999
Sold by
Anderson Janel L
Bought by
Huang Shiu Yen
Home Financials for this Owner
Home Financials are based on the most recent Mortgage that was taken out on this home.
Original Mortgage
$88,200
Interest Rate
6.86%
Create a Home Valuation Report for This Property
The Home Valuation Report is an in-depth analysis detailing your home's value as well as a comparison with similar homes in the area
Home Values in the Area
Average Home Value in this Area
Purchase History
| Date | Buyer | Sale Price | Title Company |
|---|---|---|---|
| Wang Hong Liang | $188,000 | Stewart Title | |
| Wu Nancy | $155,000 | Investors Title Company | |
| Huang Shiu Yen | $126,000 | American Title Co |
Source: Public Records
Mortgage History
| Date | Status | Borrower | Loan Amount |
|---|---|---|---|
| Open | Wang Hong Liang | $141,000 | |
| Previous Owner | Wu Nancy | $124,000 | |
| Previous Owner | Huang Shiu Yen | $88,200 | |
| Closed | Wang Hong Liang | $18,800 |
Source: Public Records
Tax History Compared to Growth
Tax History
| Year | Tax Paid | Tax Assessment Tax Assessment Total Assessment is a certain percentage of the fair market value that is determined by local assessors to be the total taxable value of land and additions on the property. | Land | Improvement |
|---|---|---|---|---|
| 2025 | $3,877 | $272,266 | $147,866 | $124,400 |
| 2024 | $3,877 | $266,928 | $144,967 | $121,961 |
| 2023 | $3,808 | $261,695 | $142,125 | $119,570 |
| 2022 | $3,655 | $256,565 | $139,339 | $117,226 |
| 2021 | $3,625 | $251,535 | $136,607 | $114,928 |
| 2019 | $3,473 | $244,076 | $132,556 | $111,520 |
| 2018 | $3,441 | $239,291 | $129,957 | $109,334 |
| 2016 | $3,278 | $230,001 | $124,911 | $105,090 |
| 2015 | $3,233 | $226,547 | $123,035 | $103,512 |
| 2014 | $3,208 | $222,110 | $120,625 | $101,485 |
Source: Public Records
Map
Nearby Homes
- 1230 Elm Ave Unit G
- 1290 Elm Ave Unit D
- 1349 Elm Ave
- 1120 E Las Tunas Dr Unit 2
- 6013 N Walnut Grove Ave
- 6138 Avon Ave
- 1281 E Broadway
- 5823 Myda Ave
- 5716 N Charlotte Ave
- 118 N Gladys Ave Unit F
- 0 Sultana Ave
- 6137 Rosemead Blvd
- 6250 Deerfield Ave
- 5613 N Charlotte Ave
- 6159 Rosemead Blvd
- 5619 Sultana Ave Unit A
- 5635 Noel Dr
- 101 N San Gabriel Blvd
- 345 N San Gabriel Blvd
- 6227 Sultana Ave
- 1237 Elm Ave Unit K
- 1237 Elm Ave Unit J
- 1237 Elm Ave Unit H
- 1237 Elm Ave Unit F
- 1237 Elm Ave Unit E
- 1237 Elm Ave Unit D
- 1237 Elm Ave Unit C
- 1237 Elm Ave Unit B
- 1237 Elm Ave Unit A
- 1257 Elm Ave Unit K
- 1257 Elm Ave Unit J
- 1257 Elm Ave Unit H
- 1257 Elm Ave Unit G
- 1257 Elm Ave Unit F
- 1257 Elm Ave Unit E
- 1257 Elm Ave Unit D
- 1257 Elm Ave Unit B
- 1257 Elm Ave Unit A
- 1259 Elm Ave
- 1221 Elm Ave