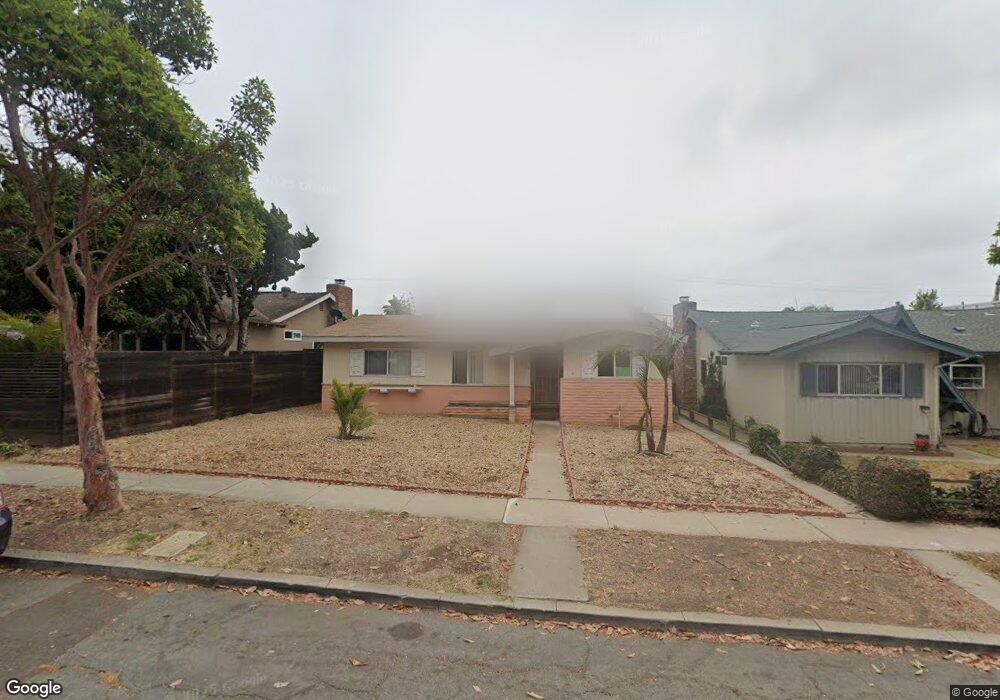
1257 Tourmaline St San Diego, CA 92109
Pacific Beach NeighborhoodEstimated Value: $1,617,000 - $1,931,000
4
Beds
3
Baths
1,520
Sq Ft
$1,174/Sq Ft
Est. Value
About This Home
This home is located at 1257 Tourmaline St, San Diego, CA 92109 and is currently estimated at $1,784,097, approximately $1,173 per square foot. 1257 Tourmaline St is a home located in San Diego County with nearby schools including Pacific Beach Elementary School, Pacific Beach Middle, and Mission Bay High School.
Ownership History
Date
Name
Owned For
Owner Type
Purchase Details
Closed on
Mar 4, 2008
Sold by
Ranglas Tom and Ranglas Nikolitsa Tom
Bought by
Ranglas Tom and Ranglas Nikolitsa T
Current Estimated Value
Home Financials for this Owner
Home Financials are based on the most recent Mortgage that was taken out on this home.
Original Mortgage
$265,000
Outstanding Balance
$164,292
Interest Rate
5.65%
Mortgage Type
Purchase Money Mortgage
Estimated Equity
$1,619,805
Purchase Details
Closed on
Oct 25, 2007
Sold by
Ranglas Nikolitsa Tom
Bought by
Ranglas Nikolitsa T and Nikolitsa Ranglas Trust
Purchase Details
Closed on
Apr 19, 2007
Sold by
Ranglas Jennifer Rebecca
Bought by
Ranglas Tom
Home Financials for this Owner
Home Financials are based on the most recent Mortgage that was taken out on this home.
Original Mortgage
$265,000
Interest Rate
6.11%
Mortgage Type
New Conventional
Purchase Details
Closed on
Mar 25, 1996
Sold by
Ranglas Sophia
Bought by
Ranglas Nikolitsa Tom and Ranglas Tom
Create a Home Valuation Report for This Property
The Home Valuation Report is an in-depth analysis detailing your home's value as well as a comparison with similar homes in the area
Home Values in the Area
Average Home Value in this Area
Purchase History
| Date | Buyer | Sale Price | Title Company |
|---|---|---|---|
| Ranglas Tom | -- | Ticor Title Company | |
| Ranglas Tom | -- | Ticor Title Company | |
| Ranglas Nikolitsa Tom | -- | Ticor Title Company | |
| Ranglas Nikolitsa T | -- | None Available | |
| Ranglas Tom | -- | Financial Title Company | |
| Ranglas Tom | -- | Financial Title Company | |
| Ranglas Nikolitsa Tom | -- | -- |
Source: Public Records
Mortgage History
| Date | Status | Borrower | Loan Amount |
|---|---|---|---|
| Open | Ranglas Nikolitsa Tom | $265,000 | |
| Closed | Ranglas Tom | $265,000 | |
| Closed | Ranglas Tom | $265,000 |
Source: Public Records
Tax History Compared to Growth
Tax History
| Year | Tax Paid | Tax Assessment Tax Assessment Total Assessment is a certain percentage of the fair market value that is determined by local assessors to be the total taxable value of land and additions on the property. | Land | Improvement |
|---|---|---|---|---|
| 2025 | $2,052 | $167,461 | $74,368 | $93,093 |
| 2024 | $2,052 | $164,178 | $72,910 | $91,268 |
| 2023 | $2,006 | $160,960 | $71,481 | $89,479 |
| 2022 | $1,953 | $157,805 | $70,080 | $87,725 |
| 2021 | $1,940 | $154,711 | $68,706 | $86,005 |
| 2020 | $1,917 | $153,126 | $68,002 | $85,124 |
| 2019 | $1,883 | $150,124 | $66,669 | $83,455 |
| 2018 | $1,762 | $147,181 | $65,362 | $81,819 |
| 2017 | $1,720 | $144,296 | $64,081 | $80,215 |
| 2016 | $1,691 | $141,468 | $62,825 | $78,643 |
| 2015 | $1,667 | $139,344 | $61,882 | $77,462 |
| 2014 | $1,641 | $136,615 | $60,670 | $75,945 |
Source: Public Records
Map
Nearby Homes
- 1154 Sapphire St
- 5209 Foothill Blvd
- 1148 Turquoise St
- 1059 Agate St Unit A
- 1025 Wilbur Ave
- 972 Sapphire St Unit LA1
- 974 Sapphire St Unit LA2
- 976 Sapphire St Unit LA3
- 938 Opal St
- 4944 Cass St Unit 604
- 4944 Cass St Unit 407
- 1505 Loring St
- 1045 Van Nuys St
- 1326 Caminito Arriata
- 5448 Caminito Bayo
- 1329 Caminito Balada
- 1220 Emerald St
- 1270 Emerald St
- 751-63 Turquoise St Unit 27-30
- 1712 Beryl St
- 1253 Tourmaline St
- 1263 Tourmaline St
- 1273 Tourmaline St
- 1241 Tourmaline St
- 1258 Opal St
- 1264 Opal St
- 1233 Tourmaline St
- 1254 Opal St
- 1274 Opal St
- 1242 Opal St
- 1227 Tourmaline St
- 1234 Opal St
- 5085 Fanuel St
- 1228 Opal St
- 1221 Tourmaline St
- 1304 Opal St
- 1311 Tourmaline St
- 1222 Opal St
- 1211 Tourmaline St
- 1312 Opal St