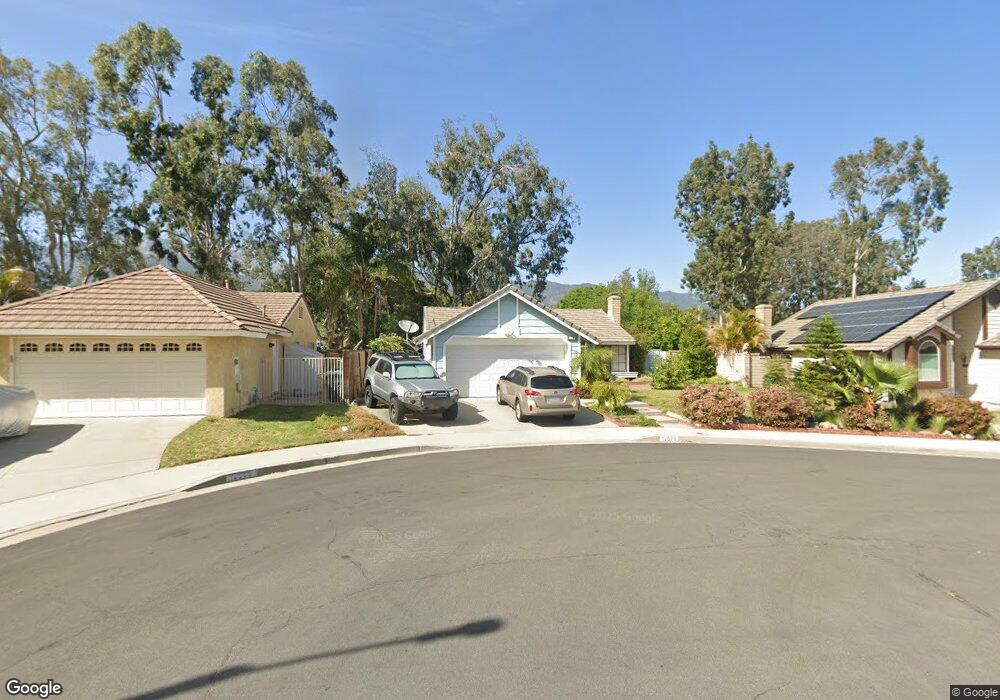
12570 Aster Ct Rancho Cucamonga, CA 91739
Victoria NeighborhoodEstimated Value: $609,067 - $635,000
2
Beds
2
Baths
930
Sq Ft
$667/Sq Ft
Est. Value
About This Home
This home is located at 12570 Aster Ct, Rancho Cucamonga, CA 91739 and is currently estimated at $620,517, approximately $667 per square foot. 12570 Aster Ct is a home located in San Bernardino County with nearby schools including Windrows Elementary School, Etiwanda Intermediate, and Rancho Cucamonga High School.
Ownership History
Date
Name
Owned For
Owner Type
Purchase Details
Closed on
Nov 16, 2012
Sold by
Montalto Vincenza
Bought by
Montalto Vincenza and Pavia Pietronilla
Current Estimated Value
Purchase Details
Closed on
Feb 3, 2005
Sold by
Anderson Tracy
Bought by
Montalto Vincenza
Home Financials for this Owner
Home Financials are based on the most recent Mortgage that was taken out on this home.
Original Mortgage
$250,000
Outstanding Balance
$126,904
Interest Rate
5.73%
Mortgage Type
Credit Line Revolving
Estimated Equity
$493,613
Purchase Details
Closed on
Jun 18, 1999
Sold by
Flordelis Anthony A
Bought by
Anderson Tracy
Home Financials for this Owner
Home Financials are based on the most recent Mortgage that was taken out on this home.
Original Mortgage
$121,600
Interest Rate
7.4%
Create a Home Valuation Report for This Property
The Home Valuation Report is an in-depth analysis detailing your home's value as well as a comparison with similar homes in the area
Home Values in the Area
Average Home Value in this Area
Purchase History
| Date | Buyer | Sale Price | Title Company |
|---|---|---|---|
| Montalto Vincenza | -- | None Available | |
| Montalto Vincenza | $325,000 | Fidelity Nationaltitle Co | |
| Anderson Tracy | $128,000 | Commonwealth Land Title Co |
Source: Public Records
Mortgage History
| Date | Status | Borrower | Loan Amount |
|---|---|---|---|
| Open | Montalto Vincenza | $250,000 | |
| Previous Owner | Anderson Tracy | $121,600 |
Source: Public Records
Tax History Compared to Growth
Tax History
| Year | Tax Paid | Tax Assessment Tax Assessment Total Assessment is a certain percentage of the fair market value that is determined by local assessors to be the total taxable value of land and additions on the property. | Land | Improvement |
|---|---|---|---|---|
| 2025 | $4,094 | $326,330 | $104,672 | $221,658 |
| 2024 | $4,094 | $319,932 | $102,620 | $217,312 |
| 2023 | $3,986 | $313,659 | $100,608 | $213,051 |
| 2022 | $3,925 | $307,509 | $98,635 | $208,874 |
| 2021 | $3,852 | $301,479 | $96,701 | $204,778 |
| 2020 | $3,808 | $298,387 | $95,709 | $202,678 |
| 2019 | $3,717 | $292,536 | $93,832 | $198,704 |
| 2018 | $3,710 | $286,800 | $91,992 | $194,808 |
| 2017 | $3,548 | $281,176 | $90,188 | $190,988 |
| 2016 | $4,070 | $335,000 | $117,600 | $217,400 |
| 2015 | $3,919 | $319,000 | $112,000 | $207,000 |
| 2014 | $3,711 | $303,000 | $106,000 | $197,000 |
Source: Public Records
Map
Nearby Homes
- 6921 Dahlia Ct
- 6822 Foxtail Ct
- 6732 Plum Way
- 7077 Iris Place
- 7153 Walcott Place
- 12325 Bellflower Ct
- 7068 Crocus Ct
- 7067 Fontaine Place
- 6992 Fontaine Place
- 12356 Thistle Dr
- 12501 Solaris Dr Unit 42
- 7334 Nightfall
- 6318 Echo Mountain
- 13042 Larrera St
- 12842 Tilden Dr
- 13031 Vista St
- 6502 Dogwood Place
- 12331 Dove Tree Dr
- 12538 Old Port Ct
- 12420 Silk Oak Ct
- 12580 Aster Ct
- 12560 Aster Ct
- 12590 Aster Ct
- 12602 Aster Ct
- 12563 Aster Ct
- 12575 Aster Ct
- 12608 Aster Ct
- 12597 Aster Ct
- 12609 Aster Ct
- 12574 Begonia Ct
- 12566 Begonia Ct
- 12588 Begonia Ct
- 6938 Tipu Place
- 6928 Tipu Place
- 6912 Tipu Place
- 12618 Aster Ct
- 12596 Begonia Ct
- 12483 Tulip Ct
- 12492 Veronica Ct
- 12606 Begonia Ct