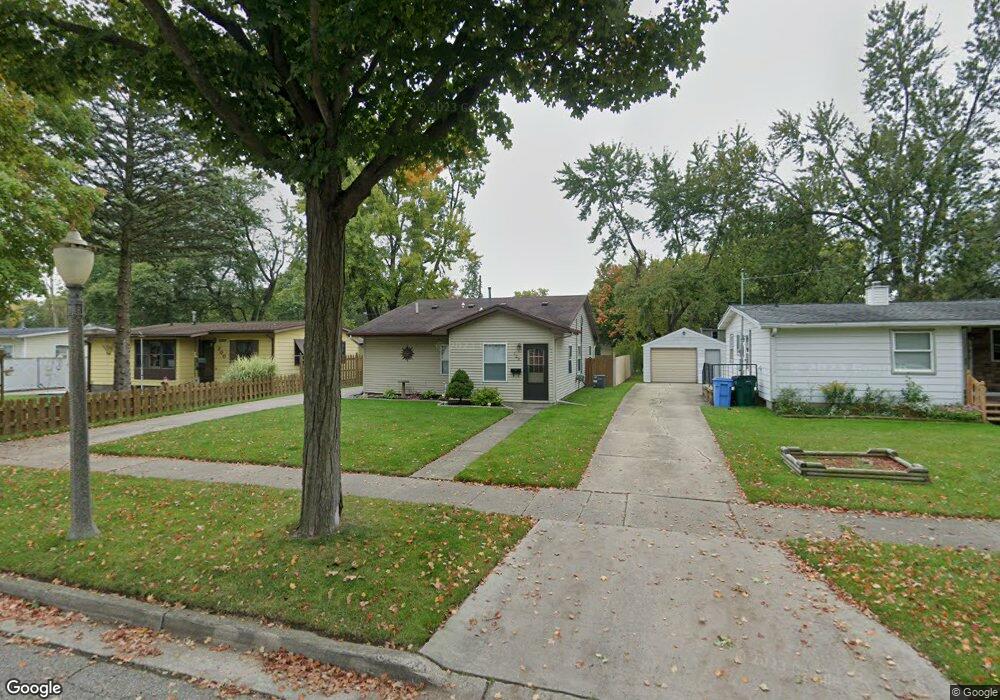
126 Cox Blvd Lansing, MI 48910
Old Everett NeighborhoodEstimated Value: $112,000 - $152,000
3
Beds
1
Bath
1,128
Sq Ft
$118/Sq Ft
Est. Value
About This Home
This home is located at 126 Cox Blvd, Lansing, MI 48910 and is currently estimated at $133,122, approximately $118 per square foot. 126 Cox Blvd is a home located in Ingham County with nearby schools including Kendon School, Attwood School, and Everett High School.
Ownership History
Date
Name
Owned For
Owner Type
Purchase Details
Closed on
Mar 18, 2010
Sold by
Mcnamara Mary Sarah
Bought by
Ragle Nicole A
Current Estimated Value
Home Financials for this Owner
Home Financials are based on the most recent Mortgage that was taken out on this home.
Original Mortgage
$55,967
Outstanding Balance
$37,131
Interest Rate
5%
Mortgage Type
FHA
Estimated Equity
$95,991
Purchase Details
Closed on
Jul 30, 2009
Sold by
Secretary Of Housing & Urban Development
Bought by
Mcnamara Mary Sarah
Purchase Details
Closed on
Nov 3, 2008
Sold by
Magna Bank
Bought by
Us Department Of Housing & Urban Develop
Purchase Details
Closed on
Sep 18, 2008
Sold by
Goodwell Timothy Robert
Bought by
Magna Bank and 1St Trust Bank For Savings
Purchase Details
Closed on
Sep 21, 1999
Sold by
Graves Alan D and Graves Dianna M
Bought by
Goodwell Timothy Robert
Home Financials for this Owner
Home Financials are based on the most recent Mortgage that was taken out on this home.
Original Mortgage
$74,961
Interest Rate
7.9%
Mortgage Type
FHA
Create a Home Valuation Report for This Property
The Home Valuation Report is an in-depth analysis detailing your home's value as well as a comparison with similar homes in the area
Home Values in the Area
Average Home Value in this Area
Purchase History
| Date | Buyer | Sale Price | Title Company |
|---|---|---|---|
| Ragle Nicole A | $57,000 | Midstate | |
| Mcnamara Mary Sarah | $25,000 | None Available | |
| Us Department Of Housing & Urban Develop | -- | None Available | |
| Magna Bank | $75,548 | None Available | |
| Goodwell Timothy Robert | $75,000 | -- |
Source: Public Records
Mortgage History
| Date | Status | Borrower | Loan Amount |
|---|---|---|---|
| Open | Ragle Nicole A | $55,967 | |
| Previous Owner | Goodwell Timothy Robert | $74,961 |
Source: Public Records
Tax History
| Year | Tax Paid | Tax Assessment Tax Assessment Total Assessment is a certain percentage of the fair market value that is determined by local assessors to be the total taxable value of land and additions on the property. | Land | Improvement |
|---|---|---|---|---|
| 2025 | $2,471 | $59,000 | $6,900 | $52,100 |
| 2024 | $2,318 | $48,100 | $6,900 | $41,200 |
| 2023 | $2,318 | $43,900 | $6,900 | $37,000 |
| 2022 | $2,091 | $37,500 | $6,300 | $31,200 |
| 2021 | $2,048 | $37,100 | $3,700 | $33,400 |
| 2020 | $2,035 | $36,300 | $3,700 | $32,600 |
| 2019 | $1,950 | $35,800 | $3,700 | $32,100 |
| 2018 | $1,828 | $32,300 | $3,700 | $28,600 |
| 2017 | $1,750 | $32,300 | $3,700 | $28,600 |
| 2016 | $1,683 | $30,400 | $3,700 | $26,700 |
| 2015 | $1,683 | $29,800 | $7,457 | $22,343 |
| 2014 | $1,683 | $29,500 | $4,661 | $24,839 |
Source: Public Records
Map
Nearby Homes
- 201 E Syringa Dr
- 111 E Potter Ave
- 106 E Everettdale Ave
- 221 W Everettdale Ave
- 205 E Jolly Rd Unit 6
- 522 E Cavanaugh Rd
- 4022 Stabler St
- 600 E Cavanaugh Rd
- 629 Emily Ave
- 601 Jessop Ave
- 600 W Cavanaugh Rd
- 3805 Donald St
- 5267 Crocus Ave
- 4907 Burchfield Ave
- 709 Jessop Ave
- 4125 Lowcroft Ave
- 4926 Burchfield Ave
- 4806 Lyncott Dr
- 817 Jessop Ave
- 3723 Weger Place
Your Personal Tour Guide
Ask me questions while you tour the home.