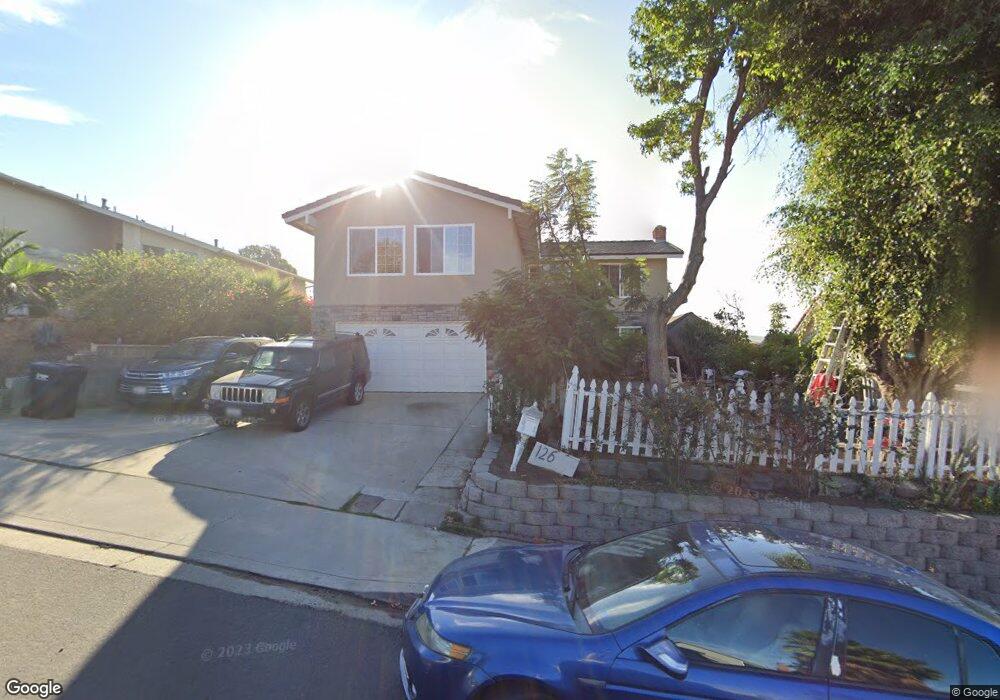
126 Meadowlark Ave Chula Vista, CA 91911
Castle Park NeighborhoodEstimated Value: $847,051 - $883,000
5
Beds
4
Baths
2,080
Sq Ft
$416/Sq Ft
Est. Value
About This Home
This home is located at 126 Meadowlark Ave, Chula Vista, CA 91911 and is currently estimated at $865,013, approximately $415 per square foot. 126 Meadowlark Ave is a home located in San Diego County with nearby schools including Loma Verde Elementary School, Castle Park Middle School, and Castle Park High School.
Ownership History
Date
Name
Owned For
Owner Type
Purchase Details
Closed on
Nov 8, 2003
Sold by
Arteaga Antonio and Arteaga Maria
Bought by
Arteaga Jorge and Arteaga Antonio
Current Estimated Value
Home Financials for this Owner
Home Financials are based on the most recent Mortgage that was taken out on this home.
Original Mortgage
$239,000
Outstanding Balance
$109,953
Interest Rate
5.89%
Mortgage Type
Purchase Money Mortgage
Estimated Equity
$755,060
Purchase Details
Closed on
Feb 22, 1994
Sold by
Garcia Jose A and Garcia Rosa M
Bought by
Arteaga Antonio and Arteaga Maria
Home Financials for this Owner
Home Financials are based on the most recent Mortgage that was taken out on this home.
Original Mortgage
$175,655
Interest Rate
8.12%
Purchase Details
Closed on
Jan 17, 1989
Purchase Details
Closed on
Jan 24, 1986
Create a Home Valuation Report for This Property
The Home Valuation Report is an in-depth analysis detailing your home's value as well as a comparison with similar homes in the area
Home Values in the Area
Average Home Value in this Area
Purchase History
| Date | Buyer | Sale Price | Title Company |
|---|---|---|---|
| Arteaga Jorge | -- | First Southwestern Title | |
| Arteaga Antonio | $185,000 | Orange Coast Title Company | |
| -- | $159,500 | -- | |
| -- | $113,500 | -- |
Source: Public Records
Mortgage History
| Date | Status | Borrower | Loan Amount |
|---|---|---|---|
| Open | Arteaga Jorge | $239,000 | |
| Closed | Arteaga Antonio | $175,655 |
Source: Public Records
Tax History Compared to Growth
Tax History
| Year | Tax Paid | Tax Assessment Tax Assessment Total Assessment is a certain percentage of the fair market value that is determined by local assessors to be the total taxable value of land and additions on the property. | Land | Improvement |
|---|---|---|---|---|
| 2025 | $5,269 | $449,628 | $199,222 | $250,406 |
| 2024 | $5,269 | $440,813 | $195,316 | $245,497 |
| 2023 | $5,196 | $432,171 | $191,487 | $240,684 |
| 2022 | $5,047 | $368,580 | $148,917 | $219,663 |
| 2021 | $4,307 | $368,580 | $148,917 | $219,663 |
| 2020 | $4,204 | $364,802 | $147,391 | $217,411 |
| 2019 | $4,095 | $357,650 | $144,501 | $213,149 |
| 2018 | $4,029 | $350,638 | $141,668 | $208,970 |
| 2017 | $11 | $343,764 | $138,891 | $204,873 |
| 2016 | $3,999 | $337,024 | $136,168 | $200,856 |
| 2015 | $3,795 | $331,962 | $134,123 | $197,839 |
| 2014 | $3,730 | $325,460 | $131,496 | $193,964 |
Source: Public Records
Map
Nearby Homes
- 131 Rainier Ct
- 140 Rainier Ct
- 1568 Larkhaven Dr
- 1532 Grand Teton Ct
- 1650 Sycamore Dr
- 1640 Maple Dr Unit 32
- 1640 Maple Dr Unit 4
- 133 Lotus Dr
- 52 Rivera Place
- 4052 Main St
- 1519 Marble Ct
- 237 Otay Valley Rd Unit C
- 3965 Otay Valley Rd
- 353 Tourmaline Ct
- 1677 Melrose Ave Unit H
- 3755 Holiday Ct
- 3753-55 Holiday Ct
- 1720 Melrose Ave Unit 27
- 50 Tamarindo Way
- 1434 Hilltop Dr Unit 35
- 132 Meadowlark Ave
- 120 Meadowlark Ave
- 138 Meadowlark Ave
- 114 Meadowlark Ave
- 125 Meadowlark Ave
- 131 Meadowlark Ave
- 119 Meadowlark Ave
- 144 Meadowlark Ave
- 137 Meadowlark Ave
- 108 Meadowlark Ave
- 133 Rainier Ct
- 1557 Skylark Way
- 1556 Skylark Way
- 135 Rainier Ct
- 143 Meadowlark Ave
- 1529 Larkhaven Dr
- 1545 Larkhaven Dr
- 1533 Larkhaven Dr
- 137 Rainier Ct
- 1557 Larkhaven Dr